
The Investigation and Analysis of Line Junction Detection in Biomedical Images
Abstract
Line junction detection plays a vitaltask in the segmentation of biomedical images in various applications such as liver blood vessel detection, diabetic retinopathy, neuron reconstruction studies, etc. Previous line junction techniques hugely depend upon skeletonization and image segmentation. In this paper, we present line junction detection based on three kinds of filters such as Gaussian filter, directional filter, Gabor filter,and Histogram of Oriented Gradient (HOG) employed for the line junction score measurement, ridge forks and branches detection, ridge point detection and junction strength detection respectively. We have conducted extensive experimentation on the DRIVE retinal fundus image database. The proposed algorithm's performance is evaluated based on qualitative and quantitative analysis, and it is observed that the proposed technique outperforms traditional approaches. It results in an averageaccuracy, precision, recall and F1-score of 96.60%, 92.50%, 94.08 and 95.40% for line junction detection on DRIVE dataset.
Keywords:Line detectionGaussian filterGabor filterDirectional filter
1. Introduction
Line junction detection is crucial in biomedical image processing such as diabetic retinopathy, lung cancer detection, liver cancer detection. The junction is the point where two or more regions or lines are connected. The junctions are generally divided into two types such as natural junction (general junctions) and line junction. Natural intersection represents the connection of two or more image regions, whereas line junction represents the connection point of two or more lines. Depending on the relationship of several regions and lines, junctions are categorized in 'L' junction, 'T' or 'Y' junction or higher-order junctions. 'L' junction is formed by the connection of two regions or lines, 'T' or 'Y' junctions are formed by the connection of three regions or lines, and higher-order junctions are created by the connection of multiple regions and lines. Different types of natural junctions and line junctions are shown in Fig. 1.
Line junction approaches categorized in three types such as signal-intensity, contour and template-based approaches. Ridge points, forks, and ridge branches are the significant properties of the line. The signal-intensity based systems are based on the detection of changes in intensity over the local region such as FAST (features from accelerated segment test) corner detector [1], [2], Smallest Univalve Segment Assimilating Nucleus (SUSAN) [3], Harris’s method [4], etc. Contour-based approaches are based on contour estimation and junction localization, such as JUDOCA (junction detection operator based on circumferential anchors) [5], Maire’s method [6], and Xia’s contrary detection theory [7]. Template-based approaches consider junction center models for the matching [8].
a. b. c.
d. e. f.
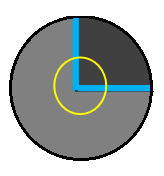
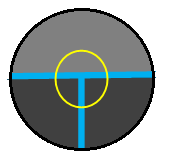
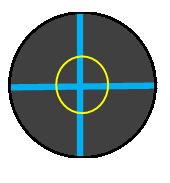
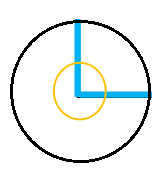
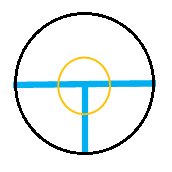
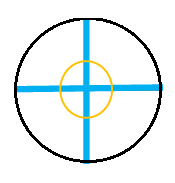
Recently, Radojevic et al. [9] presented line junction and termination detection in neuron microscopic images based on fuzzy logic. They have used two-level fuzzy logic for mapping the features of neuron tiny images obtained from the directional filter and angular profile analysis. Shrinidhi et al. [10] proposed Vessel Key-Points Detection (VKD) and Curvature Orientation Histogram (COH) for the extraction of line junctions and Random Forest classifier (RF) for classification of the type of junction. This method could easily discriminate between the complex crossover and bifurcation points. Utsu et al. [11] presented a multi-task network based on Restricted Boltzmann Machine (RBM) for detecting vessel junctions, edges, and center lines of retinal fundus images to minimize the scarcity problem of labeled data from DRIVE and IOSTAR database. It resulted in a precision of 0.75 and 0.67 for the DRIVE and IOSTAR databases, respectively. Most of the traditional techniques are sensitive to the noise in the detection of thinner lines in images. It is observed that anisotropy helps to minimize the stretch effect and gives better results for line detection in noisy images [12].
In this paper, we present the robust method for line junction detection in complex biomedical images. The proposed method consists of line scoremeasurement using Gaussian filter, multi-orientation branches and ridge forks detections using Directional Filter Bank (DFB), ridge point detection using Gabor filter, and junction strength detection using Histogram of Oriented Gradients (HOG).
The rest of the paper is contributed as follows. Section 2 elaborates the proposed methodology. Section 3 highlights the experimental results with a detailed discussion. And further, Section 4 provides the conclusion and prospect of the work.
2. Related Work
3. Proposed Methodology
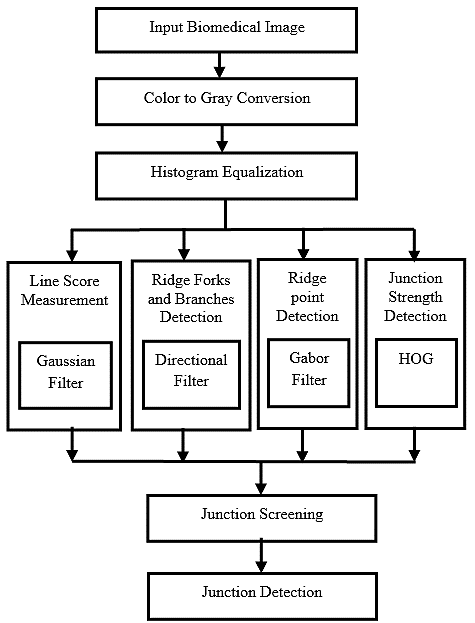
The flow diagram of the proposed methodology is shown in Fig. 2. It includes of image pre-processing, line score measurement using Gaussian filter, ridge forks and branches detection using direction filter, ridge point detection using Gabor filter, and junction strength detection using HOG descriptor, junction screening, and junction detection.
3.1 Pre-Processing
In the pre-processing stage, a 3-D color image is transformed into a 2-D grayscale image, which minimizes the time computation. Also, gray images can characterize the structure of lines in images. Further, histogram equalization is employed to the gray image to deal with noise minimization, blur reduction, and uneven light distribution minimization [13].
3.2 Line Score Measurement
The Gaussian filter is used for approximating the line profile, which gives the probability of each gray pixel of the image to be a line junction [14–16]. The Gaussian curve function can be given by Eq. (1).
1 (x − μ) w w exp (− ) − ≤ x ≤ ,
g(x) = { 2 (1)
√2πσ 2σ 2 2 0 Otherwise, where μ and σ represent the mean and standard deviation of the Gaussian curve. The line widths are limited by narrowing the Gaussian curve in the range of [− , ], where w ≤ 2σ.
3.3 Ridge Forks and Branch Detection
A DFB is utilized to divide the image in the preferred number of sub-bands containing features in the provided angular range [17]. A directional filter gives a peak value along the line direction because several branches are connected to the junction in multiple directions. The directional filter gives lower changes for the homogeneous region because of the unavailability of directional lines. 16 DFB is used to estimate ridge forks and branches [18].
3.4 Ridge Point Detection
Gabor filter gives multidirectional features that are used to estimate the ridge-like points in the biomedical images [19–21]. The complex domain Gabor function can be given by Eqs. (2)-(4).
′2 2 ′2 ′
x + γ y x
g(x, y) = exp {− } . exp {i (2π + ψ), (2)
2σ λ
x = xcosϴ + ysinϴ, (3) y = −xsinϴ + ycosϴ, (4)
where, λ- Wavelength of sinusoidal components.
ϴ- Direction of the element in various directions.
(π/8,π/4, 3π/8,π/2, 5π/8, 3π/4, 7π/8 and π).
γ- Spatial aspect ratio.
σ- Divergence of gaussian envelope .
Ψ- Phase offset.
The Gabor filter implementation parameters are given in Table 1.
Table 1. Gabor filter implementation parameters.
This table is shown in the PDF version of the article.
3.5 Junction Strength Detection
Dalal and Trigs invent HOGfor object detection, and it is prevalent for shape description in object detection tasks [22]. HOG gives the line strength in a different direction. Line junction has the maximum value in the HOG descriptor, distinguishing the line junction point and average texture point. HOG focuses on the shape structure of the image and checks the individual pixel, whether it is part of the edge or not, along with its direction. The image is split into the smaller local region called cells, and for every region, gradients and orientations are computed. Finally, histograms of such local region gradients are collected together [23], [24]. The image is resized to 200 × 200 pixels to consider a single descriptor window per image. The images' horizontal and vertical gradients are computed by convolving the input image with a horizontal derivative and vertical derivative kernel filter [25]. The horizontal and vertical filter kernels are given in Eq. (5) and Eq. (6).
HKx = [−1 0 1]. (5) HKy = [−1 0 1] . (6)
A horizontal gradient image gives the vertical lines or changes in the image while vertical gradient image horizontal changes (see Eq. (7) and Eq. (8)).
= ⊗ . (7) Iy = Im ⊗ HKy. (8)
The gradient's magnitude is computed using horizontal and vertical gradients of images given by Eq. (9).
I = √I + I . (9)
Mag x y
The orientations of gradients are computed over 9 bin over the angle of 0 to 180 degree using Eq. (10).
Iy
Θ = tan ( ). (10)
Ix Further, the histograms of the gradient are computed over the descriptor block of 200 x 200 pixels. The descriptor block is divided into cell of 8x 8 pixels. One clock is made up of 2x2 cells and 50 % overlapping of blocks is considered for block normalization, minimizing the effect of the light variation over the image region [26].
3.6 Junction Screening
The junction screening is done based on maximum weight combination from the Gaussian filter output, directional filter output, Gabor filter output, and HOG descriptor. The blob of a small region is selected to analyze the junction behavior in the image. Overlapping junction blobs are neglected in the final screening of the junction.
4. Experimental Results and Discussions
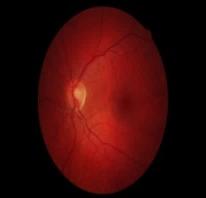
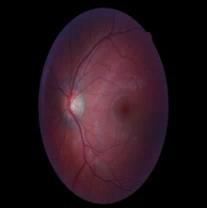
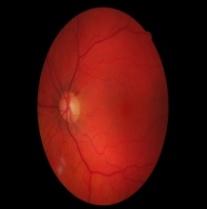
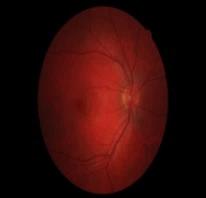
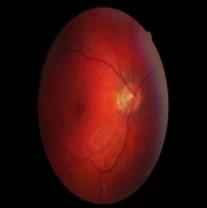
The proposed system is implemented using MATLAB programming on the personal laptop with 8GB RAM, a core i5 processor with 2.64GHz speed, and a windows environment. We have used the DRINOS database that consists of retinal fundus images [27]. Some of the samples from the DRINOS dataset are given in Fig.
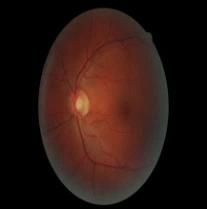
The experimental results for the various stages of the proposed algorithm are shown in Fig. 4.
a. b.
c. d.
e. f.
g. h.
i. j.
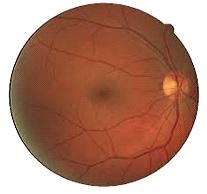
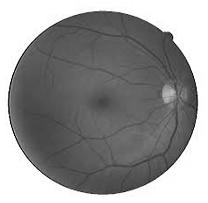
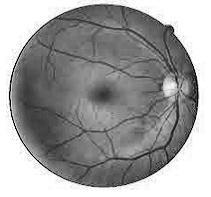
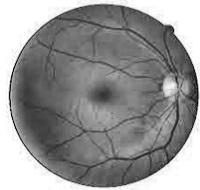
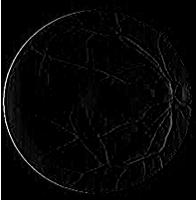
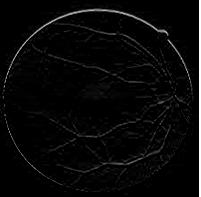
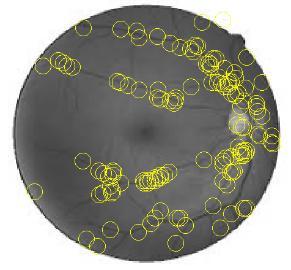
The experimental results are evaluated by varying different parameters of the proposed system. The performance of the Gausssian filter is analyzed for the different window size and different Gabor directions (N) such as 3×3, 5×5 and 7×7 as shown in Fig. 5.
Window=3×3 Window=5×5 % Accuracy 60 50 Window =7×7 N=2 N=4 N=8 Gabor Direction (N)
It is observed that the smaller Gaussian window of 3×3 pixels fails to detect the larger junction points and larger Gaussian window of 7×7 pixels neglects the smaller junctions of the lines. Medium Gaussian window of 5×5 pixels better describes the junction smoothness in the local window and hence provides higher accuracy. Considering the eight directions for Gabor edges computation gives significant improvement over N=2 and N=4.
The effect of various HOG parameters is analyzed for the line and line junction detection such as cell size, block size, overlapping and number of Bins. The HOG results are computed for 3×3 pixel Gaussian window and Gabor filter with N=8.
Cell=4×4 70 Cell= 8×8 % Accuracy Cell = 12×12 6×6 4×4 2×2 Cell = 16×16 HOG Block Size (cells)
In HOG, 8×8 pixel cell size gives the better representation of the lines and junctions in the retinal images. Lower cell size (4×4) may results loss of gradient and higher cell size (12×12 and 16×16 pixel) may neglect the fine gradients and edges in the retinal images. Fig. 6 shows for 2×2 cell block the HOG describes the better edges and helps in normalization of edges in retinal images. For one cell 9 bin histograms are computed; thus one block gives total 36 histograms.
80 No Overlapping 70 25 % Overlapping % Accuracy 50 % Overlapping 75 % Overlapping
6×6 4×4 2×2 HOG Block Size (cells) Fig. 7 shows that 50 % overlapping of the blocks gives normalization of the edges and reduces blur noise in line compared to no overlapping, 25 % overlapping, and 75 % overlapping.
Increasing the number of bins, improves the number of orientation of the gradients per cell. It provides the edge information in 9 direction in between 0 degree to 180 degree. Higher bin values are avoided to minimize the computational complexity. Fig. 8 shows that 9 bin histogram gives noteworthy results for the line junction detection in retinal images.
% Accuracy
1 3 5 7 9 Number of Bins
The performance of the proposed system is evaluated based on the accuracy, precision, recall, and F1-score. The proposed algorithm has shown significant improvement over the previous JUNR and Su’s method as given in Table 2.
Table 2. Result comparison on DRIVE dataset.
This table is shown in the PDF version of the article.
5. Conclusions
Thus in the paper, we have presented multidirectional line junction detection in biomedical images using different texture, shape, and directional descriptors. The Gaussian filter is used for the line junction estimation, and a Directional filter is used to detect ridge branches estimation. Gabor filter is used to detect ridge points, and HOG descriptor is used for the junction strength detection. The combination of four algorithmsis used to detect the line junction in retinal fundus images. The proposed algorithm is efficient and straightforward. It has given better accuracy for line junction detection compared to the previous state of arts. Our work's future scope consists of implementing the proposed technique for the liver blood vein junction detection and palm vein junction detection.
Acknowledgments
The authors express their gratitude to their respective institutions for the academic and technical assistance provided during this research.
Funding
This research did not receive any specific funding from public, commercial, or nonprofit organizations.
Data Availability
The dataset utilized in this research is publicly accessible. Further scripts and algorithm implementations can be requested from the corresponding author upon a reasonable request.
Conflicts of Interest
The authors confirm that there are no conflicts of interest associated with the publication of this article. The research was carried out in an impartial and independent way.
Figures
The PDF also contains 3 images in a format that could not be extracted automatically.
References
- [1] Rosten, E., & Drummond, T. (2005). Fusing points and lines for high performance tracking. Proceedings of the IEEE international conference on computer vision (pp. 1508–1515). IEEE. https://doi.org/10.1109/ICCV.2005.104
- [2] Rosten, E., & Drummond, T. (2006). Machine learning for high-speed corner detection. Lecture notes in computer science (including subseries lecture notes in artificial intelligence and lecture notes in bioinformatics) (pp. 430–443). Springer. https://doi.org/10.1007/11744023_34
- [3] Smith, S. M., & Brady, J. M. (1997). SUSAN-A new approach to low level image processing. International journal of computer vision, 23(1), 45–78. https://doi.org/10.1023/A:1007963824710
- [4] Harris, C., & Stephens, M. (2013). A combined corner and edge detector. Alvey vision conference, 15(50), 23.1-23.6. https://doi.org/10.5244/c.2.23
- [5] Elias, R., & Laganière, R. (2012). JUDOCA: junction detection operator based on circumferential anchors. IEEE transactions on image processing, 21(4), 2109–2118. https://doi.org/10.1109/TIP.2011.2175738
- [6] Maire, M., Arbelaez, P., Fowlkes, C., & Malik, J. (2008). Using contours to detect and localize junctions in natural images. 2008 IEEE conference on computer vision and pattern recognition (pp. 1–8). IEEE. https://doi.org/10.1109/CVPR.2008.4587420
- [7] Xia, G. S., Delon, J., & Gousseau, Y. (2014). Accurate junction detection and characterization in natural images. International journal of computer vision, 106(1), 31–56. https://doi.org/10.1007/s11263-013-0640-1
- [8] Parida, L., Geiger, D., & Hummel, R. (1998). Junctions: detection, classification, and reconstruction. IEEE transactions on pattern analysis and machine intelligence, 20(7), 687–698. https://doi.org/10.1109/34.689300
- [9] Radojević, M., Smal, I., & Meijering, E. (2016). Fuzzy-logic based detection and characterization of junctions and terminations in fluorescence microscopy images of neurons. Neuroinformatics, 14(2), 201–
- [219] https://doi.org/10.1007/s12021-015-9287-0
- [10] Srinidhi, C. L., Rath, P., & Sivaswamy, J. (2017). A vessel keypoint detector for junction classification. 2017 IEEE 14th international symposium on biomedical imaging (ISBI 2017) (pp. 882–885). IEEE. https://doi.org/10.1109/ISBI.2017.7950657
- [11] Uslu, F., & Bharath, A. A. (2018). A multi-task network to detect junctions in retinal vasculature. Lecture notes in computer science (including subseries lecture notes in artificial intelligence and lecture notes in bioinformatics) (Vol. 11071 LNCS, pp. 92–100). Springer. https://doi.org/10.1007/978-3-030-00934-2_11
- [12] Wang, G., Lopez-Molina, C., Vidal-Diez de Ulzurrun, G., & De Baets, B. (2019). Noise-robust line detection using normalized and adaptive second-order anisotropic Gaussian kernels. Signal processing, 160, 252–
- [262] https://doi.org/10.1016/j.sigpro.2019.02.027
- [13] Bhangale, K. B., Jadhav, K. M., & Shirke, Y. R. (2018). Robust pose invariant face recognition using DCP and LBP. International journal of management, technology and engineering, 8(9), 1026–1034. B2n.ir/a49086
- [14] Basu, M. (2002). Gaussian-based edge-detection methods-a survey. IEEE transactions on systems, man, and cybernetics, part c (applications and reviews), 32(3), 252–260. https://doi.org/10.1109/TSMCC.2002.804448
- [15] Chutatape, O., Zheng, L., & Krishnan, S. M. (1998). Retinal blood vessel detection and tracking by matched gaussian and kalman filters. Proceedings of the 20th annual international conference of the ieee engineering in medicine and biology society. vol. 20 biomedical engineering towards the year 2000 and beyond (cat. no. 98ch36286) (Vol. 6, pp. 3144–3149). IEEE. https://doi.org/10.1109/IEMBS.1998.746160
- [16] Gang, L., Chutatape, O., & Krishnan, S. M. (2002). Detection and measurement of retinal vessels in fundus images using amplitude modified second-order Gaussian filter. IEEE transactions on biomedical engineering, 49(2), 168–172. https://doi.org/10.1109/10.979356
- [17] Lu, Y. M., & Do, M. N. (2007). Multidimensional directional filter banks and surfacelets. IEEE transactions on image processing, 16(4), 918–931. https://doi.org/10.1109/TIP.2007.891785
- [18] Truc, P. T. H., Khan, M. A. U., Lee, Y. K., Lee, S., & Kim, T. S. (2009). Vessel enhancement filter using directional filter bank. Computer vision and image understanding, 113(1), 101–112. https://doi.org/10.1016/j.cviu.2008.07.009
- [19] Mehrotra, R., Namuduri, K. R., & Ranganathan, N. (1992). Gabor filter-based edge detection. Pattern recognition, 25(12), 1479–1494. https://doi.org/10.1016/0031-3203(92)90121-X
- [20] Liu, S., Niu, Z., Sun, G., & Chen, Z. (2014). Gabor filter-based edge detection: A note. Optik, 125(15), 4120– 4123. https://doi.org/10.1016/j.ijleo.2014.01.102
- [21] Zhou, S., Jiang, Y., Xi, J., Gong, J., Xiong, G., & Chen, H. (2010). A novel lane detection based on geometrical model and gabor filter. 2010 IEEE intelligent vehicles symposium (pp. 59–64). IEEE. https://doi.org/10.1109/IVS.2010.5548087
- [22] Dalal, N., & Triggs, B. (2005). Histograms of oriented gradients for human detection. 2005 IEEE computer society conference on computer vision and pattern recognition (CVPR’05) (pp. 886–893). IEEE. https://doi.org/10.1109/CVPR.2005.177
- [23] Bhangale, K. B. (2014). Human body detection in static images using HOG & piecewise linear SVM. International journal of innovative research and development, 3(6), 179–184. B2n.ir/m48593
- [24] Kato, T., Relator, R., Ngouv, H., Hirohashi, Y., Takaki, O., Kakimoto, T., & Okada, K. (2015). Segmental HOG: new descriptor for glomerulus detection in kidney microscopy image. BMC bioinformatics, 16(1), 1–
- [16] https://doi.org/10.1186/s12859-015-0739-1
- [25] Bhangale, K. B., & Mohanaprasad, K. (2020). Content based image retrieval using collaborative color, texture and shape features. International journal of innovative technology and exploring engineering, 9(3), 1466– 1469. B2n.ir/b49405
- [26] Jabshetti, G. C., Biradar, M. S., & Bhangale, K. (2016). Object detection using regionlet transform. 2016 international conference on computing, analytics and security trends (CAST) (pp. 600–604). IEEE. https://doi.org/10.1109/CAST.2016.7915038
- [27] Staal, J., Abràmoff, M. D., Niemeijer, M., Viergever, M. A., & Van Ginneken, B. (2004). Ridge-based vessel segmentation in color images of the retina. IEEE transactions on medical imaging, 23(4), 501–509. https://doi.org/10.1109/TMI.2004.825627
- [28] Su, R., Sun, C., Zhang, C., & Pham, T. D. (2014). A new method for linear feature and junction enhancement in 2D images based on morphological operation, oriented anisotropic Gaussian function and Hessian information. Pattern recognition, 47(10), 3193–3208. https://doi.org/10.1016/j.patcog.2014.04.024
- [29] Zhang, H., Yang, Y., & Shen, H. (2017). Line junction detection without prior-delineation of curvilinear structure in biomedical images. IEEE access, 6, 2016–2027. https://doi.org/10.1109/ACCESS.2017.2781280