
Efficient Deep Lung Diagnostic Network (EDLD-Net) for Optimized Lung Cancer Detection in Lung CT Scans
Abstract
Lung malignancies are primary causes of cancer related deaths worldwide where chances of successful cures will be significantly impacted by early disease identifications. Computed Tomography (CT) is one of the best imaging techniques for identifying lung cancer. The Convolutional Neural Network (CNN) approach is inefficient and takes more time and processing resources for real-time or resource-constrained applications. We suggested the Efficient Deep Lung Diagnostic Network (EDLD-Net) method, which lowers computational complexity, to solve this problem. Otsu thresholding is used to separate areas of interest, Sobel filtering is used to emphasize the boundaries of possible tumor locations, and histogram equalization is used to resize and enhance CT scan images in order to increase contrast and minimize noise. The method reduces data redundancy by using adaptive pooling and the Grey-Level Co-Occurrence Matrix (GLCM) for texture feature extraction. Images are categorized as malignant or non-cancerous using lightweight CNNs that employ Transfer Learning (TL), which improves models’ accuracies while minimizing execution times. Lung Image Database Consortium and Image Database Resource Initiative (LIDC-IDRI) dataset, a generally established benchmark for lung cancer detections, was utilized to train and validate models where the dataset dramatically reducing execution times for real-time applications while maintaining 99.85% accuracy, 99.75% sensitivity, and 99.80% specificity. These findings show that, especially in clinical settings with limited computational resources, EDLD-Net offers a scalable, cost-effective, and precise method to lung cancer detection.
Keywords:Lung cancer detectionComputed tomographyTransfer learningGrey-level co-occurrence matrix
1. Introduction
Improved patient outcomes are dependent on early and accurate detection of lung cancers, one of the most lethal cancer forms and leading cause of cancer related global mortalities. Early detections, which are commonly performed by imaging modalities like Computed Tomography (CT) scans, significantly enhance probabilities of survivals [1]. Technological advances in Machine Learning (ML) and Deep Learning (DL) have hastened developments in automated diagnostic tools, particularly Convolutional Neural Networks (CNNs) which are capable of reliably analyzing CT scans.
However, many conventional and deep CNN architectures require substantial computational resources, resulting in lengthy processing times that limit their deployment in real-time clinical settings with limited infrastructure.
Efficient Deep Lung Diagnostic Network (EDLD-Net) strives to overcome these limitations by providing computationally efficiency while maintaining better diagnostic accuracies [2], [3]. EDLD-Net's lightweight CNNs designed for Transfer Learning (TL) allows adaptation to lung cancer data while also learning from pre-trained models. The strategy significantly decreases computing costs while retaining CNNs' major advantages while identifying complicated patterns from lung images. To guarantee that final features are meaningful and computationally manageable, the model pre-processes CT images where image contrasts and segmentations are enhanced. This is followed by robust feature extractions via GLCM analysis and adaptive
This figure is shown in the PDF version of the article.
EDLD-Net saves processing times and energies by reducing computational complexities [4], [5]. EDLD-Net selects important features for lung cancer classifications, making it suitable for real-time or resource-constrained applications, as opposed to typical CNNs that use dense architectures to analyze image data [6]. This selective processing not only reduces computing times, but also increases model's sensitivity and specificity values in distinguishing malignant and non-malignant lung tissues.
Even though CNNs are effective at processing medical images, classical models have several limitations when utilized for real-time diagnosis [7–9], particularly when short turnaround times or low resource consumption are necessary. Traditional CNNs have significant disadvantages in identifying lung cancers and include increased latencies owing to models complexities, reliance on huge datasets, and higher memory needs. These restrictions restrict the use of CNNs in healthcare settings, where quicker and simpler diagnostic tools are required. The EDLD-Net architecture explicitly addresses these concerns, reducing processing resource needs while maintaining diagnostic accuracy.
EDLD-Net combines feature selections, image processing, and adaptive pooling into lightweight networks to strike compromises between computational economy and diagnostic precisions [10]. When compared to previous techniques, this considerably shortened execution times while maintaining good performances in evaluation metrics such as accuracy, sensitivity, and specificity. Hence, EDLD-Net is a scalable and efficient technology for identifying lung cancers, making their usage optimal choices for early detections in clinical settings with limited resources.
2. Literature Review
Ren et al. [11] suggested Lung Cancer Generative Adversarial Network (GAN-TL), Lung Cancer Generative Adversarial Network (LCGANT) for lung cancer classifications. The system's two main components are a Visual Geometry Group DeepFake Dataset (VGG-DF) regularization-augmented TL model, which splits the simulated lung cancer images into three groups, and a deep convolutional GAN (LCGAN), which generates the images. The purpose of this strategy was to reduce overfitting while increasing classification accuracy. Evaluation revealed that the framework beat other cutting-edge algorithms in lung cancer classification tasks, earning the top score on the dataset.
Faruqui et al. [12] proposed a novel hybrid deep-CNN-based model that uses CT scan images and Medical Internet of Things (MIoT) sensor data to increase the diagnostic accuracy of lung cancer detection. To address the difficult task of combining two data sets, the model employed a modified 22-layer CNN that extracts latent characteristics from CT scans and MIoT data. To achieve maximal performance, the network was trained on a balanced dataset of 525,000 images obtained from a centralized server. According to the assessment, LungNet will beat comparable CNN-based classifiers for lung cancer in five areas.
Pathan et al. [13] recommended utilizing CNNs optimized for Sine Cosine Algorithms (SCAs) in automating diagnostics for screening lung cancers from CT slices,. This strategy sought to address the issue of information loss caused by random image smoothing by developing a specialized pre-processing solution for lung CT images. The SCA optimization technique was implemented into the CNN, with error reduction as the target function, to ensure correct parameter selection. The proposed approach accurately identified normal, malignant, and benign lung scans. On an untested dataset, it displayed high generalization performance, and quantitative findings confirmed its suitability for clinical use by radiologists.
Wankhade and Vigneshwari [14] suggested a Cancer Cell Detection using Hybrid Neural Network (CCDC-HNN) that extracts information from CT scan images using deep neural networks, allowing precise and early diagnostics of lung cancers. The technique aimed to improve feature extraction accuracies in detecting malignant cells earlier, a critical aspect for protecting patients affected with the disease. Implementing a powerful 3D-Convolution Neural Network (3D-CNN) improved diagnostic accuracy by making it easier to distinguish between benign and malignant tumors. Using established statistical approaches, we verified the effectiveness of our hybrid DL strategy for early lung cancer identification.
Saha et al. [15] suggested Vessel Extraction and Reconstruction Network (VER-Net), a new model for diagnosing lung tumors where three separate TL models were sacked and trained on lung CT scan data. To boost classification accuracy, the algorithm overlaid CT scan data for four different forms of lung cancer. Many strategies, including as data augmentation, image preprocessing, and hyperparameter tweaking, were used to increase VER-Net's utility. Multiclass classifications based on chest CT images were used to train and evaluate each model. Experimental findings showed that VER-Net performed better than eight other models for TL. The results showed that VER-Net outperformed state-of-the-art methods in lung cancer categorization.
Thanoon et al. [16] outlined a DL system for lung cancer screening and detection. Additionally included were suggestions for lung cancer applications, an outline of several DL methodologies, and advancements in the methods being studied. The focus was on two fundamental DL methods for lung cancer screening and diagnosis: segmentation and classification algorithms. The assessment also covered the benefits and drawbacks of the DL models in use today.
The results showed that DL techniques have a great deal of promise for accurate and effective CT image-based computer-assisted lung cancer screening and diagnosis. Following this evaluation, the study made many recommendations for possible future initiatives aimed at expanding the application of DL to direct the creation of computer-assisted lung cancer detection systems.
Vidhya and Mirnalinee [17] developed a novel classification model utilizing optimum learning networks and fused features for lung CT scan data. The framework's first segmentation used the saliency map concept to enhance classification maps and get rid of overfitting issues. The model integrated deep CNNs with Ant-Lion Optimized Feed Forward Layers (ALO_FFL) to enhance malignancy classification. The Lung Image Database Consortium and Image Database Resource Initiative (LIDC-IDRI) image datasets were carefully tested, and TensorFlow 1.8, Python 3.8, and the Keras API were utilized for implementation. The F1-score, accuracy, sensitivity, specificity, and precision were the performance measures generated and analyzed. When compared to current models, the simulation results verified the superiority of the proposed framework in lung cancer classification tasks.
Rathan and Lokesh [18] presented Lung Cancer Detector and Stage Classifier (LCDSC) approach intended to assess severities of pulmonary illnesses while recognizing and categorizing stages of lung cancers. The strategy outperformed previous methods for detecting lung cancers in terms of accuracy, sensitivity, specificity, recall, and precision values. The model effectively segregated lung cancer using an active contour model and identified stages with a High-Resolution Net (HRNet). Validation was performed using the benchmark Lung Image Database Consortium and The Image Database Resource Initiative (LIDC-IDRI). The results showed a high degree of classification accuracy for lung cancer stages. This approach provides a realistic alternative for early identification of lung cancer, which may lead to better patient outcomes.
Naseer et al. [19] suggested three phase modified U-Net architectures for lobe segmentations and nodule identifications. The first phase included segmenting CT slices into lobes using modified U-Nets. The second stage involved extracting possible nodules using revised U-Net architectures, but using projected masks and labels. The last phase involved using Support Vector Machines (SVMs) based on modified AlexNets to determine whether candidate nodules were malignant or non-cancerous. The results of studies using enhanced AlexNet-SVM classification models on publicly available LUAN16 datasets were positive.
Prasad et al. [20] presented DL and fuzzy K-means clustering, and demonstrated a simple but successful method for categorizing lung pictures, reducing false positives, and segmenting malignancies. The technology gave more accurate findings than human doctors and outperformed previous methods in the literature. The initial part of the procedure involved segmenting the lungs and categorizing the images as either normal or sick. Pre-processing, feature extraction, tumor segmentation, and feature selection utilizing the crow search optimization technique comprised the first stage. F ollowing pre-processing, the CT image's texture properties were recovered and noise was eliminated. An artificial neural network distinguished between normal and pathological lung images. In the second phase, the fuzzy K-means method was employed to independently segment tumors from abnormal images, with SVM classifiers used to further reduce false positives. The system demonstrating superior performance in sensitivity, specificity, and accuracy compared to numerous systems reported in the literature. The proposed solution effectively balanced effectiveness and efficiency while also reducing computation time.
3. Proposed Methodology
Fig. 2 displays the suggested process flow block diagram for improved algorithms for detecting lung cancers. The proposed approach includes many important stages to improve the accuracy of lung cancer diagnosis. Pre-processing techniques such as noise reduction, histogram equalization, and scaling are used to enhance the quality of CT images. Global Image Thresholding and Sobel Filtering are then used to partition the lung regions and enhance edge detection. While feature extraction employs the GLCM to gather crucial textural information, adaptive pooling reduces the dimensionality of the data. To provide accurate and effective lung cancer diagnosis, a lightweight CNNs with TL is utilized for classification. Classification metrics are used to assess the model's performance.
This figure is shown in the PDF version of the article.
3.1 Pre-Processing
Lung Image Database Consortium (LIDC) provides annotated CT scans images for research and detections of lung cancers. These images serve as input data for further processing in the detection algorithm.
3.1.1 Resizing (color mapping)
Resizing is dealing with medical images like CT scan are typically grayscale, if the images are in Red, Green, Blue (RGB) format, they need to be converted to grayscale [21]. Grayscale images simplify further processing and reduce computational complexity since each pixel is represented by a single intensity value rather than three color components (R, G, B).
Grayscale images have a single channel for pixel intensity, unlike RGB images, which have three channels. This reduces the complexity of image analysis, such as edge detection, segmentation, and feature extraction. By reducing the number of dimensions (from 3 to 1), the image analysis process becomes faster and more efficient, particularly for algorithms like CNNs used in detecting lung cancers. One of the most effective methods for converting an RGB image to grayscale is the luminosity method. Unlike other simpler methods like averaging the RGB values, the luminosity method considers the human eye’s sensitivity to different colors. The human eye perceives green more strongly than red or blue, and this method adjusts the grayscale conversion accordingly.
The grayscale value G is calculated using the following weighted represented as Eq. (1),
G = 0.21R + 0.72G + 0.07B, (1)
where:
I. R represents red components of pixels .
II. G represents green components of pixels .
III. B represents blue components of pixels .
The weights 0.21, 0.72, and 0.07 are chosen based on the human eye’s sensitivity to these colors .
The red, green, and blue components of pixels in RGB images are taken out. The luminosity formula is used to calculate the grayscale value. To create a single-channel grayscale image, this procedure is repeated for each pixel in the image .
3.1.2 Noise reduction
Following grayscale conversion, noise reduction is applied to suppress artifacts and improve image clarity. Subsequently, histogram equalization is employed to enhance contrast by redistributing pixel intensities for more accurate analysis. Various filtering techniques are applied to remove random artifacts or "noise" from CT images, enhancing clarity and preserving important structural details for accurate lung cancer detection. Noises in CT scans can be from various sources, including imaging equipments limitations or patient movements, and can obscure essential features such as tumor boundaries.
Smoothens images by averaging the intensity values of pixels within a defined neighbourhood by gaussian filtering. These processes reduce high frequency noises while maintaining larger image structures. The Gaussian filter uses a Gaussian function to assign weights to neighbouring pixels, where closer pixels contribute more to the average than those further away. The Gaussian function is represented as Eq. (2),
G(x, y) = 1 e−x2 2σ +y 22, (2)
2πσ2 where:
I. G(x, y) is the Gaussian function applied at pixel position (x, y).
II. σ represents the standard deviation, controlling the extent of smoothing (higher values lead to stronger smoothing).
III. e represents bases of natural logarithms.
Gaussian kernels produced from these functions are convolved across pictures, replacing pixels with weighted averages of their neighbors. The processes smooth sounds by lowering artifact intensities while keeping progressive intensity changes, which are critical for sustaining edges and other key features.
The effective technique is Median Filtering, particularly useful for eliminating "salt-and-pepper" noise (intense light or dark spots). Here, a 3x3 or 5x5 neighborhood of pixels is selected around each pixel, and the central pixel's intensity is replaced by the median intensity value from this neighborhood. Unlike Gaussian filtering, median filtering preserves sharp edges more effectively, as it does not blur the image but instead replaces outliers, which helps retain critical details for accurate lung cancer detection. These noise reduction techniques ensure that the processed CT images maintain clarity, enhancing EDLD-Net’s ability to identify lung cancer features accurately and efficiently.
3.1.3 Histogram equalization
The enhanced contrast in the image allows for improved visualization of critical features as tumor boundaries and lung structures by stretching pixel intensity values across the full grayscale spectrum (0–255). It helps in understanding contrast and brightness of images. Pixel counts of intensities are used to create frequency distributions of intensities [22]. Cumulative Distribution Functions (CDF) provide cumulative probabilities of pixel intensities and are used in histogram equalizations to spread out pixel values over full intensity ranges. Accumulate the histogram values, so that each intensity level represents the sum of all previous intensities up to that point in Fig. 3.
This figure is shown in the PDF version of the article.
Normalize the CDF to fit the intensity range of the image, which is typically 0–255 for an 8-bit grayscale image it expressed as Eq. (3) and Eq. (4).
(cdf − cdfmin) × (L − 1)
cdfnormalized = . (3)
(M × N − cdfmin)
Output Pixel = cdfnormalized[input pixel]. (4)
Round the converted pixel values to the closest integer for display reasons. More contrast will be present in the final image, making important details like possible tumors clearer for the program to analyze further.
3.2 Segmentation
3.2.1 Global Thresholding
The fundamental idea behind global thresholding is that if an image contains a bimodal histogram, it may be used to separate an object from the background by comparing its values with a threshold value T. Assume that the histogram in Fig. 4 is present in the image f(x,y) .
This figure is shown in the PDF version of the article.
There are two primary possibilities for the arrangement of the background and object pixels' gray levels [23]. They can be excluded from backdrops using thresholds T that separates these modes. Thresholded images g(x,y) are defined as g(x, y) and represented as Eq. (5).
1 if(x, y) > T,
g(x, y) = { (5)
0 if(x, y) ≤ T.
This figure is shown in the PDF version of the article.
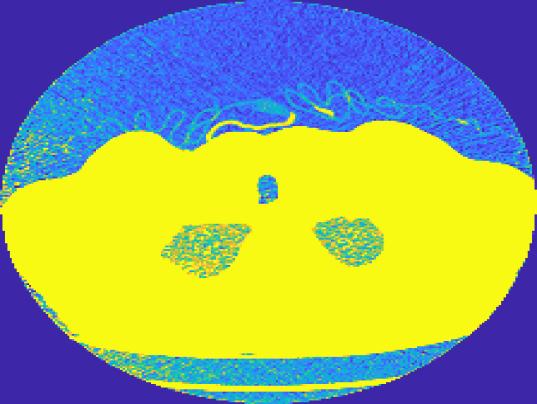
Thresholding results in a binary image, where pixels with an intensity value of 1 indicate objects, and pixels with a value of 0 represent the backdrop (see Fig. 5). White cells on a black background were present in the original photograph. The range of pixel intensities is 0 to 255. The minimum between two modes on a histogram was determined to be T = 127.
3.2.2 Sobel filter
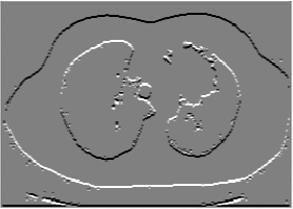
Functions I(x,y) that assess pixel intensities at pixel coordinates (x,y) can be used to depict grayscale images. The partial derivatives of the image, or δI (x, y)/δx in the X and Y directions, are required as input for many computer vision applications. These partial derivatives are commonly abbreviated as Ix(x,y) and Iy(x,y). One common technique for computing these partial derivatives is the Sobel filter shown in Fig. 6.
The impact of using Sobel filters on original Lena image is for X and Y partial derivatives. White pixels in these images stand in for edges. An image can also be reduced to its edges, or the separations between its objects, using the Sobel filter [24]. This can be accomplished by computing the norm of the X and Y derivatives of each pixel, which is represented as Eq. (6).
δI(x, y) δI(x, y)
√( ) + ( ) . (6)
δx δy
The application must fully compute the X and Y derivatives from the original image in order to employ this "edge detection" approach, producing two intermediate images. The final image must then be calculated by combining these intermediate photographs using the conventional procedure. The coefficient matrices of the Sobel filter are represented by Eq. (7) and Eq. (8).
−1 0 1
Gx = [−2 0 2], (7)
−1 0 1 and
1 2 1
Gy = [ 0 0 0 ], (8)
−1 −2 −1 which can be divided into column pass and row pass filters as Eq. (9) and Eq. (10),
−1 0 1 1
Gx = [−2 0 2] = [2] [−1 0 1]. (9)
−1 0 1 1 1 2 1 1
Gy = [ 0 0 0 ] = [ 0 ] [1 2 1]. (10)
−1 −2 −1 −1 Contrast = ∑(i − j)2P(i, j). (11)
Energy = ∑(P(i, j)2). (12)
Entropy = ∑ (P(i, j) log 2 (P(i, j))). (13)
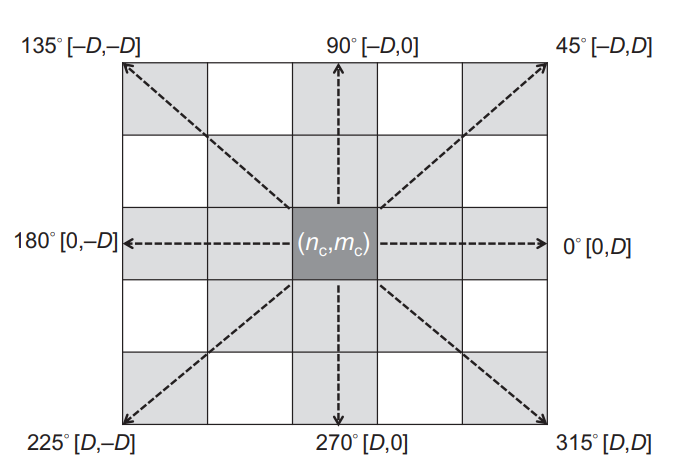
3.3.2 Adaptive pooling layer
Adaptive pooling reduce dimensionalities of extracted feature maps without losing critical information [26]. It dynamically adjusts the pooling regions based on the input size, preserving important features while maintaining computational efficiency.
I. In each feature map (output from the GLCM phase), set a target output size (e.g., 2×22 \times 22×2 or 4×44 \times 44×4). Adaptive pooling then divides each feature map into sub-regions based on the target size.
II. For each sub-region, aggregate pixel values (typically by taking the maximum or average). This reduces the feature map size while retaining the most important data within each region.
III. The resulting output is a smaller, dimensionally consistent feature map that maintains essential texture information. This compressed form of the feature map reduces computational demands during classification without sacrificing significant details.
Together, GLCM and adaptive pooling work effectively to extract and refine texture features for lung cancer detection, leading to an accurate and efficient classification model. Fig. (8) shows the implementation of
This figure is shown in the PDF version of the article.
3.4 Classification
3.4.1 Transfer learning with lightweight convolutional neural network
The process begins with CNN models trained using sizable and varied datasets (like ImageNet). Strong feature extraction capabilities and efficiency are provided by models with optimized architectures, such as MobileNet, EfficientNet, and ResNet. Since their layer designs can recognize intricate patterns in visual data—a crucial ability for identifying early indicators of lung cancer in CT images—these models have demonstrated efficacy in a variety of medical image analysis tasks (see Fig. 9).
This figure is shown in the PDF version of the article.
After selecting a suitable pre-trained CNN, the model is adapted for lung cancer classification by replacing the final dense layers with task-specific layers corresponding to binary output classes. This approach allows the network to leverage pre-learned generic visual features while specializing its prediction capability for lung CT image analysis. Previous studies have shown that such fine-tuning strategies improve classification performance in medical imaging tasks.
The initial layers are frozen, retaining the features learned from the pre-trained dataset. Only the last few layers are fine-tuned with the lung CT dataset to adapt the model to cancer detection without needing to re-train the entire model [27]. This approach not only saves computation time but also improves model accuracy and specificity by focusing learning on patterns relevant to the lung CT images while leveraging previously learned general features. Fine-tuning has proven effective for enhancing model performance in lung cancer diagnosis.
The modified and fine-tuned model is then trained on the lung CT images. By using a lightweight CNN architecture, the model can efficiently, making it well-suited for high-throughput clinical environments where quick and accurate classification is critical. Lightweight CNNs like MobileNet and EfficientNet have shown superior performance in handling medical image classification tasks at scale, balancing speed and accuracy effectively.
Train the adapted model on the pre-processed LIDC-IDRI images. The model minimizes a binary cross-entropy loss function represented as Eq. (14),
Loss = − ∑[yi ∙ log(y ̂i) + (1 − yi) ∙ log(1 − y ̂i)]. (14)
In the context of lung cancer detection, TL with a lightweight CNN model is a powerful approach to classify lung CT images (see Fig. 10), offering both high performance and computational efficiency.
This figure is shown in the PDF version of the article.
TL capitalizes on pre-trained models that have already learned meaningful visual features from large-scale datasets, such as ImageNet, and applies this knowledge to the specific task of lung cancer classification. Lightweight CNN models, such as ImageNet, Mobile Net, Efficient Net, and ResNet, are favored due to their architecture, which is both resource-efficient and highly capable of handling image classification tasks at large scales. This enables accurate differentiation between cancerous and non-cancerous tissues.
4. Experimental Result and Anlaysis
To assess the effectiveness of the proposed TL -based lightweight CNN model, experiments were conducted using the LIDC-IDRI dataset for training and validation. Lung Cancer CT image dataset, where pre-processing is applied to enhance image quality by resizing, histogram equalization, and noise reduction. Following this, thresholding and filtering are performed using global image thresholding and Sobel filter-based smoothing, enhancing relevant features for better analysis. The foundation of feature extractions is adaptive pooling, which lowers dimensionality while maintaining significant features, and GLCM, which captures texture information. A lightweight CNN with TL is used for categorization in order to take use of previously learned information and increase efficiency. Performance metrics including sensitivity, specificity, accuracy, and processing time reduction are computed to evaluate the model's accuracy in identifying lung cancer. The final findings in Table 1 demonstrate the effectiveness of the proposed strategy when compared to the existing approaches1.
Specificity: Specificities are proportions of true negatives identified correctly by models and represented as Eq. (16). They indicate models’ abilities to correctly classify non-tumors or non-cancer cases.
TN
Specificity = . (16)
(TN + FP) Sensitivity: The percentage of true positives that the model detected is known as sensitivity. It shows how well the model can categorize cases of cancer or tumors it represented as Eq. (17),
TP
Sensitivity = . (17)
TP + FN Accuracy: The Eq. (18) can be used to determine the detection accuracy of lung cancer:
(TP + TN)
Accuracy = . (18)
(TP + TN + FP + FN)
1 From the following link the LIDC-IDRI dataset is collected, https://www.cancerimagingarchive.net/collection/lidc-idri/Execution time: When the suggested algorithm runs in less time, the system performs better.
Where FP stands for False Positive, FN for False Negative, TN for True Negative, and TP for True Positive (identified tumors) (Table. 1).
Table 1. Performance evaluation.
This table is shown in the PDF version of the article.
The Fig. 11, illustrate the specificity performance of four classification methods, highlighting significant differences. TL with lightweight CNN achieves the highest specificity at 99.45%, closely followed by CNN architecture at 99.13%, indicating these methods excel in correctly identifying true negatives. In contrast, CNN with AlexNet shows a lower specificity of 95%, suggesting a higher rate of false positives, and CNN AlexNet + SGD improves on AlexNet alone with a specificity of 97.25%, but still lags behind the lightweight TL and standard CNN methods. This analysis demonstrates that both the simpler CNN architecture and lightweight TL outperform the more complex AlexNet-based methods in specificity.
This figure is shown in the PDF version of the article.
The Fig. 12, illustrate the sensitivity of four classification methods, indicating their effectiveness in identifying true positives. TL with lightweight CNN achieves the highest sensitivity at 99.4%, slightly surpassing CNN architecture at 99.11%, which suggests both methods excel in detecting positive cases. CNN AlexNet + SGD follows with a sensitivity of 97.58%, while CNN with AlexNet has the lowest sensitivity at 95.71%, indicating a higher rate of missed positive cases. This comparison highlights that both the lightweight TL model and standard CNN architecture are more reliable for accurate positive detections than the AlexNet-based methods, particularly the standalone AlexNet.
This figure is shown in the PDF version of the article.
The Fig. 13, illustrates the accuracy performance of four different CNN-based methods. The CNN Architecture achieves high accuracy, reaching nearly 99.27%, indicating a strong baseline performance. CNN with AlexNet shows the lowest accuracy among the methods, hovering around 94%, suggesting that AlexNet alone may not be as effective in this context. When combined with Stochastic Gradient Descent (SGD), CNN AlexNet + SGD improves significantly, achieving around 97.42% accuracy, which highlights the positive impact of using SGD for optimization in AlexNet. Lastly, TL with Lightweight CNN demonstrates the highest accuracy, reaching 99.4%, showcasing the advantages of TL and a lightweight CNN model in enhancing performance. Overall, TL with lightweight CNN stands out as the most effective method, followed by the basic CNN architecture, while AlexNet benefits notably from the addition of SGD.
This figure is shown in the PDF version of the article.
The Fig. 14, illustrates the execution times of four CNN-based methods, measured as a percentage. CNN Architecture has a moderate execution time of around 25%, balancing performance with efficiency. CNN with AlexNet is slightly higher at approximately 27%, indicating marginally more computational demand than the baseline CNN architecture. CNN AlexNet + SGD exhibits the longest execution time, reaching around 35%, suggesting that the addition of SGD optimization significantly increases computational overhead. In contrast, TL with Lightweight CNN shows the lowest execution time at around 10%, underscoring the efficiency advantage of using TL combined with a lightweight model. Overall, while CNN AlexNet + SGD sacrifices execution time for improved accuracy, TL with Lightweight CNN provides a favorable balance of high accuracy and low computational cost, making it the most efficient option among the methods.
This figure is shown in the PDF version of the article.
5. Conclusion
In conclusion, the proposed EDLD-Net successfully addresses the limitations of conventional CNN models in lung cancer detection by significantly reducing computational complexity while maintaining high diagnostic accuracy and reduce the processing time. Through efficient pre-processing techniques like histogram equalization and Otsu thresholding, along with a lightweight CNN architecture enhanced by TL, EDLD-Net ensures rapid and accurate classification of CT images, making it suitable for real-time and resource-constrained environments. This approach not only optimizes processing power and speed but also offers a scalable solution adaptable to clinical needs. Future work could explore the integration of EDLD-Net with other imaging modalities or expand its application to detect a broader range of lung diseases, enhancing its utility in diverse healthcare settings.
Authors' Contributions
All aspects of the research and manuscript preparation were carried out by the authors. The authors has read and approved the final version of the manuscript.
Data Availability
All data supporting the reported findings in this research paper are provided within the manuscript.
Funding
Not applicable.
Conflict of Interest
The authors declares that they do not have any conflict of interest.
Consent for Publication
The author confirms consent for the publication of this work
Ethics Approval and Consent to Participate
This article does not contain any studies with human participants performed by the authors.
Figures
References
- [1] Ning, J., Ge, T., Jiang, M., Jia, K., Wang, L., Li, W., ..., & He, Y. (2021). Early diagnosis of lung cancer: Which is the optimal choice? Aging (Albany NY), 13(4), 6214-6212. https://doi.org/10.18632/aging.202504
- [2] Ahmed, S. T., & Kadhem, S. M. (2021). Using machine learning via deep learning algorithms to diagnose the lung disease based on chest imaging: A survey. International Journal of Interactive Mobile Technologies, 15(16), 95-112. https://doi.org/10.3991/ijim.v15i16.24191
- [3] Hatuwal, B. K., & Thapa, H. C. (2020). Lung cancer detection using convolutional neural network on histopathological images. International Journal of Computer Trends and Technology, 68(10), 21-24. https://www.ijcttjournal.org/archives/ijctt-v68i10p104
- [4] Pandian, R., Vedanarayanan, V., Kumar, D. N. S. R., & Rajakumar, R. (2022). Detection and classification of lung cancer using CNN and Google net. Measurement: Sensors, 24, 100588. https://doi.org/10.1016/j.measen.2022.100588
- [5] Kukreja, S., & Sabharwal, M. (2024). An effective lung cancer diagnosis model using the CNN algorithm. EAI Endorsed Trans. https://doi.org/10.10.4108/eai.23-11-2023.2343145
- [6] Mohamed, T. I. A., Oyelade, O. N., & Ezugwu, A. E. (2023). Automatic detection and classification of lung cancer CT scans based on deep learning and ebola optimization search algorithm. Plos One, 18(8), e0285796. https://doi.org/10.1371/journal.pone.0285796
- [7] Balaji, P., Aluvalu, R., & Sagar, K. (2023). Residual attention network based hybrid convolution network model for lung cancer detection. Intelligent Decision Technologies, 17(4), 1475–1488. https://doi.org/10.3233/IDT-230142
- [8] Alam, F. B., Podder, P., & Mondal, M. R. H. (2023). RVCNet: A hybrid deep neural network framework for the diagnosis of lung diseases. Plos One, 18(12), e0293125. https://doi.org/10.1371/journal.pone.0293125
- [9] El Asnaoui, K., Chawki, Y., & Idri, A. (2021). Automated methods for detection and classification pneumonia based on x-ray images using deep learning. Artificial intelligence and blockchain for future cybersecurity applications (pp. 257–284). Springer. https://doi.org/10.1007/978-3-030-74575-2_14
- [10] Lu, Y., Aslani, S., Zhao, A., Shahin, A., Barber, D., Emberton, M., ..., & Jacob, J. (2023). A hybrid CNN-RNN approach for survival analysis in a Lung Cancer Screening study. Heliyon, 9(8). https://doi.org/10.1016/j.heliyon.2023.e18695
- [11] Ren, Z., Zhang, Y., & Wang, S. (2022). A hybrid framework for lung cancer classification. Electronics, 11(10), 1-14. https://doi.org/10.3390/electronics11101614
- [12] Faruqui, N., Yousuf, M. A., Whaiduzzaman, M., Azad, A. K. M., Barros, A., & Moni, M. A. (2021). LungNet: A hybrid deep-CNN model for lung cancer diagnosis using CT and wearable sensor-based medical IoT data. Computers in Biology and Medicine, 139, 104961. https://doi.org/10.1016/j.compbiomed.2021.104961
- [13] Pathan, S., Ali, T., PG, S., & Rao, D. (2024). An optimized convolutional neural network architecture for lung cancer detection. APL Bioengineering, 8(2), 1-13. https://doi.org/10.1063/5.0208520
- [14] Wankhade, S., & Vigneshwari, S. (2023). A novel hybrid deep learning method for early detection of lung cancer using neural networks. Healthcare Analytics, 3, 100195. https://doi.org/10.1016/j.health.2023.100195
- [15] Saha, A., Ganie, S. M., Pramanik, P. K. D., Yadav, R. K., Mallik, S., & Zhao, Z. (2024). VER-Net: A hybrid transfer learning model for lung cancer detection using CT scan images. BMC Medical Imaging, 24(1),
- [120] https://doi.org/10.1186/s12880-024-01238-z
- [16] Thanoon, M. A., Zulkifley, M. A., Mohd Zainuri, M. A. A., & Abdani, S. R. (2023). A review of deep learning techniques for lung cancer screening and diagnosis based on CT images. Diagnostics, 13(16), 1-
- [27] https://doi.org/10.3390/diagnostics13162617
- [17] Vidhya, R., & Mirnalinee, T. T. (2022). Hybrid optimized learning for lung cancer classification. Intelligent Automation & Soft Computing, 34(2) 911-925. https://doi.org/10.32604/iasc.2022.025060
- [18] Rathan, N., & Lokesh, S. (2024). Enhanced lung cancer diagnosis and staging with hrnet: A deep learning approach. International Journal of Imaging Systems and Technology, 34(6), e23193. https://doi.org/10.1002/ima.23193
- [19] Naseer, I., Akram, S., Masood, T., Rashid, M., & Jaffar, A. (2023). Lung cancer classification using modified U-Net based lobe segmentation and nodule detection. IEEE Access, 11, 60279–60291. https://doi.org/10.1109/ACCESS.2023.3285821
- [20] Prasad, J., Chakravarty, S., & Krishna, M. V. (2022). Lung cancer detection using an integration of fuzzy K-means clustering and deep learning techniques for CT lung images. Bulletin of the Polish Academy of Sciences Technical Sciences, 70(3), 1-10. https://doi.org/10.24425/bpasts.2021.139006
- [21] Zhang, Z., Zheng, H., Hong, R., Xu, M., Yan, S., & Wang, M. (2022). Deep color consistent network for low-light image enhancement. Proceedings of the IEEE/CVF conference on computer vision and pattern recognition (pp. 1899-1908).IEEE. https://sites.google.com/site/vonikakis/datasets
- [22] Ezhilraja, K., & Shanmugavadivu, P. (2022). Performance evaluation of histogram equalization based enhancement on lung CT scan images. 2022 International conference on augmented intelligence and sustainable systems (ICAISS) (pp. 682-688). IEEE. https://doi.org/10.1109/ICAISS55157.2022.10010831
- [23] Lu, C., Graham, S., Rajpoot, N., & Madabhushi, A. (2024). Detection and quantitative enumeration of objects from large images. Medical image analysis (pp. 579–607). Elsevier. https://doi.org/10.1016/B978-0-12-813657-7.00036-4
- [24] Hawas, A. R., Ashour, A. S., & Guo, Y. (2019). Neutrosophic set in medical image clustering. Neutrosophic set in medical image analysis (pp. 167–187). Elsevier. https://doi.org/10.1016/B978-0-12-818148-5.00008-4
- [25] JJony, M. H., Johora, F. T., Khatun, P., & Rana, H. K. (2019). Detection of lung cancer from CT scan images using GLCM and SVM. 2019 1st international conference on advances in science, engineering and robotics technology (ICASERT) (pp. 1-6). IEEE. https://doi.org/10.1109/ICASERT.2019.8934454
- [26] Khan, A., Tariq, I., Khan, H., Khan, S. U., He, N., Zhiyang, L., & Raza, F. (2022). Lung cancer nodules detection via an adaptive boosting algorithm based on self-normalized multiview convolutional neural network. Journal of Oncology, 2022(1), 5682451. https://doi.org/10.1155/2022/5682451
- [27] Nahiduzzaman, M., Abdulrazak, L. F., Ayari, M. A., Khandakar, A., & Islam, S. M. R. (2024). A novel framework for lung cancer classification using lightweight convolutional neural networks and ridge extreme learning machine model with SHapley Additive exPlanations (SHAP). Expert Systems with Applications, 248, 123392. https://doi.org/10.1016/j.eswa.2024.123392