
Heart Disease Classification Using Machine Learning by Modified Support Vector Machine and Improved Ensemble Extreme Gradient Boosting (XGBoost)
Abstract
Heart disease has become a major problem recently which lowers people standard of living. In the modern world, heart disease deaths have grown to be a serious issue. Heart disease claims the life of almost one person every minute. The next two conditions on the list are breast cancer and Chronic Kidney Disease (CKD). The majority of the time, a complex combination of pathological and clinical evidence is used to make the diagnosis. This paper's goal is to use image categorization to forecast cardiac disease. Preprocessing, Feature Selection (FS), and Machine Learning (ML) classification techniques are all used in the suggested methodology. Initially, preprocessing is done using Fuzzy K-Nearest Neighbour (FKNN). Adaptive Kernel Density (AKD) and Quantum Teaching Learning based Optimization (QTLO) are used for FS. Lastly, Improved Ensemble Extreme Gradient Boosting (XGBoost) and Modified Support Vector Machines (MSVM) classify samples where accuracy, precision, recall, and f-measure are the outcomes of FS and categorization techniques. Experimental results demonstrated that the suggested approaches outperform the current system with superior quality features. In comparison to the current methods, the estimated time period and error rate are also lower. Using suggested approaches, the datasets for breast cancer and chronic renal disease are also compared, producing superior results.
Keywords:Fuzzy K-nearest neighbourQuantum teaching learning based optimizationAdaptive kernel densityModified support vector machinesImproved ensemble
1. Introduction
ML may be employed to determine if individuals have cardiac diseases as they examine volumes of patient data and provide strong tools for cardiac disease predictions. One such organ that circulates blood throughout the body is the heart; if it fails to do so, the human body may experience deadly conditions [1], [2]. Fatty deposits that accumulate on the walls of the arteries around the heart are typically the cause of heart disease. Heart conditions continue to rank among the world's top causes of death, underscoring the vital need of prompt and precise diagnosis. Heart diseases are the leading causes of adult mortality and have become fatal diseases. According to the World Health Organization, heart disease kills 17.7 million people year, accounting for 31% of global mortality [3]. This study employs image classification to determine which patients are most likely to obtain a heart disease diagnosis. Machine Learning (ML) has transformed medical imaging by allowing for automated and extremely accurate image classification. ML models may be trained to spot patterns and anomalies indicative of heart diseases by using large datasets of annotated images [4]. Image classifications are basic computer vision tasks that categorize images into pre- groups based on their visual information. These processes are essential in applications like environmental monitors, medical diagnosis, automated automobiles, and facial recognitions. Image categorization attempts to automatically assign a label to an image by studying its attributes, which may include objects, textures, patterns, or other visually differentiating components [5]. Accurately determinations of cardiac illnesses using image categorizations enable early treatments. UCI ML repository datasets were used to choose patients’ medical histories and personal traits [6], [7]. This information allows determination of cardiac disease patients. This paper focuses on image classifications using Feature Selection (FS), pre-processes, and classifications. During pre-processing, the Fuzzy K-Nearest Neighbours (FKNNs) eliminate Nans [7].
Usages of QTLO and Adaptive Kernel Density (AKD) are helpful for FS where QTLO using quantum-behaved particles method improves Teaching-Learning-Based Optimizations while AKD estimates density probabilities of random variables using kernels as weights. Improved Ensemble (XGBoost) and Modified Support Vector Machine (MSVM) are used in classifications which identify cardiac illness, by categorize input datasets [8]. An improved variant of the classic Support Vector Machines (SVM), known as MSVM, was created to solve particular issues or boost efficiency in particular applications. MSVM is a popular supervised learning method that is mostly used for classification and regression applications. It looks for the best line or hyperplane in an N-dimensional space that optimizes the distance between each class in order to classify data [9]. One effective ML technology that can help with decision-making is Extreme Gradient Boosting )XGBoost(. XGBoost is an implementation of a gradient-boosting decision tree. Being a gradient boosting approach specifically designed to be scalable and effective, it is a well-liked choice for working with large datasets. The f-measure, memory, accuracy, and precision all contribute to the excellent quality of characteristics. It also saves time compared to existing techniques [10].
2. Literature Review
Bian et al. [11] introduced XGBoost for heart disease prediction using a feature importance-based selection method. XGBoost inherently provides a feature importance score for each feature, usually based on metrics like Gini importances (mean decreases in impurities) or gain, which measures the contribution of the feature to the model's performance. XGBoost is a ML technique that uses a scalable tree boosting system to predict heart disease. XGBoost is a transparent, explainable AI model that can be used to predict the risk of myocardial infarction in both individuals and groups. It's also good at classification and understanding, and can be used in conjunction with other methods to increase forecast accuracy. The Gradient-Boosted Decision Tree (GBDT) ML program is scalable and distributed. It supports parallel tree boosting and is the finest ML program for tasks like ranking, classification, and regression. Accuracy is achieved, and the prediction model's emphasis on the importance of certain clinical parameters is emphasized.
Wang et al. [12] developed a hybrid model combining SVM with Genetic Algorithm (GA) for FS and XGBoost for classification involves a multi-step process that leverages the strengths of each component. SVM is initially used to assess feature significance, identifying a subset of characteristics that contribute to the decision boundary. This may be performed by looking at the coefficients of the SVM model. The GA FS optimization technique is based on genetic and natural selection concepts. We utilize GA to effectively search through the enormous number of alternative feature subsets and choose the best one. It combines reciprocal information maximization and adaptive evolutionary algorithms. The strategy eliminates a significant number of redundant features by increasing mutual information before identifying the best feature subset using an adaptive evolutionary algorithm. This hybrid strategy combines the great classification skills of XGBoost with the FS capabilities of SVM and GA to provide an accurate and understandable model suitable for tough jobs such as heart disease predictions.
Kaveh et al. [13] presented an FS approach that combines the benefits of SVM for initial modelling, XGBoost for final classification, and Mutual Information for feature relevance. Mutual information quantifies the reduction in uncertainty for one variable given the known value of the other. It is computed using two variables. Support Vector Machines (SVM) and XGBoost are two ML approaches that may be used to analyse data and make predictions. SVM may achieve high accuracy rates and be helpful in complex, non-linear situations when enhanced with techniques like Bayesian Optimization and data augmentation. an application of gradient-boosting decision trees that modifies data to provide accurate, efficient, and scalable results. Utilizing XGBoost can help you make better decisions. Global solar radiation and agricultural productivity have occasionally been estimated using SVM and XGBoost. The algorithms have demonstrated similar prediction accuracy in these situations, although XGBoost models have proven to be more reliable and effective than SVM techniques. By making sure that the most relevant parameters are incorporated throughout the modelling process, this technique reduces noise and improves model performance, particularly in complex prediction tasks like the classification of heart disease.
Singh et al. [14] proposed an ensemble method combining bagging, boosting, and SVM for predicting heart diseases and integrating these techniques to leverage their individual strengths for improved model accuracy and robustness. Bagging lowers variances by using bootstrapping (random samples with replacements) for generating subsets of training data. Distinct models are trained using each subgroup. The base learner for bagging is SVM. Boosting improves model performance by focusing on the mistakes of previous models. It sequentially builds models where each model corrects the errors of its predecessor. The models from Boosting are combined, typically using weighted voting, where models with higher accuracy contribute more to the final decision. This ensemble method capitalizes on the complementary strengths of Bagging, Boosting, and SVM, resulting in a model that is both accurate and robust for predicting heart disease. Both bagging and boosting methods are used to categorize heart disease. For the bagging ensemble learning approach using a decision tree, the suggested model achieved the maximum accuracy.
Van Kerm [15] designed Quantum Teaching Learning Based Optimization (QTLBO) with AKD for FS in classifying heart diseases. Their design attempted to enhance efficiency of the classification model by reducing the dimensionality of the data while maintaining high accuracy. It is a sophisticated approach that leverages optimization techniques and density estimation to improve classification performance. QTLBO is an advanced optimization algorithm inspired by quantum computing and the teaching-learning process. It aims to find optimal solutions by leveraging quantum principles and teaching-learning strategies. Kernel Density Estimations (KDE) are non-parametric techniques which estimate probabilities of random variables. Adaptive KDE adjusts the bandwidth (smoothing parameter) based on the data's local density. Apply KDE to estimate the density of the data points within each feature subset selected by QTLBO. This helps identify feature subsets where features are more uniformly distributed and potentially more informative. This results in enhanced classification performance and better insights into heart disease prediction.
Nedelea [16] developed AKD estimation for feature extraction, combined with QTLBO for optimizations. The FS process is a sophisticated approach designed to increase FS's precision and effectiveness where random variables are estimated using KDE. It facilitates the identification of areas of interest and the comprehension of feature distribution. Adaptive KDE modifies the bandwidth locally according to feature density, whereas traditional KDE smoothest using a set bandwidth. This allows for better resolution where data is dense and more smoothing where data is sparse. QTLBOs are algorithms inspired by quantum computing principles and teaching-learning processes. It is used to find optimal solutions in complex search spaces. This approach leverages Adaptive KDE for detailed feature extraction and QTLBO for optimized FS, leading to a more effective and efficient FS process that improves classification performance. It results in enhanced sensitivity and specificity which were significantly higher than those achieved by other feature extraction methods.
Ogunleye and Wang [17] suggested QTLBO combination with neural networks for heart disease classification. QTLBO was used to optimize the neural network's architecture and learning parameters. More sophisticated and precise AI systems will be made possible by QTLO's ability to effectively explore large parameter spaces and optimize ML models. It improves the stability and robustness of the TLBO by defining the quantum instructor phase. To confirm the quality and functionality of the QTLBO, two rigid planner frames and two trusses with strength and serviceability limits were selected. The optimization is carried out using the neural network's internal backpropagation algorithm. Neural networks are also effective in categorizing data into identifiable groups or attributes. This hybrid model uses benefits of QTLBO successfully and systematically to modify neural network topologies and learning parameters resulting in improving classification performances of heart illness. The merging of QTLBO with neural networks, benefits from advanced optimizations, leading to more reliable and accurate prediction performance.
Ramraj [9] used QTLBO to optimize parameters of ensembles in heart disease classifications. QTLBO aims to enhance the performance of an ensemble model for the categorization of cardiac illness by modifying its hyperparameters in order to achieve greater prediction accuracy and robustness. The ensembles included many classifiers, and QTLBO adjusted their settings to guarantee peak performances. QTLBO optimizations combined ideas from quantum computing with teaching-learning methodologies to effectively explore and optimize complex parameters. QTLBO enhances an ensemble model's ability to accurately and reliably classify heart disease by systematically determining the optimal set of parameters. It improves model performance metrics in comparison to models that are not optimized or that are traditionally tweaked. Henry et al. [18] introduced a hybrid model that included Modified SVM and XGBoost and was optimized using Grid and Random Search approaches. involves applying the benefits of both methods and carefully modifying their hyperparameters to improve classification performance. Grid searches are hyperparameter tuning techniques that include looking at every conceivable combination of hyperparameter grid values in order to identify the optimal configurations. Instead of thoroughly examining every possible combination, Random Search is a kind of Grid Search that samples hyperparameter values from predetermined distributions. A hybrid model that includes Modified SVM and XGBoost and is enhanced using Grid Search and Random Search approaches improves classification performance by leveraging the benefits of both algorithms. Grid Search provides a comprehensive search for the optimal hyperparameters, whereas Random Search offers a more adaptable approach. The hybrid approach, which integrates many models and improves their parameters, aims to improve the classification of cardiac illness in terms of accuracy, resilience, and dependability.
Naseer et al. [19] provided fuzzy logics followed by XGBoost and SVM classifications where fuzzy logics which use approximations rather than precise and fixed values. This method improved FS using fuzzy logic before using advanced classifiers to provide predictions. To deal with uncertainties and imprecisions, the work used membership functions. For regressions and classifications, SVM can determine best hyperplanes in feature spaces to increase class margins. XGBoost, an ensemble uses regularization techniques, constructs decision trees in sequential fashions, and refines models based on residuals. The performances of the SVM and XGBoost models using fuzzy-selected features resulted in better classification accuracies and resilience. The use of fuzzy logics for FS with SVM, and XGBoost classifications, the method enhanced performances while lowering dimensionalities and managing uncertainties efficiently.
3. Proposed Methodology
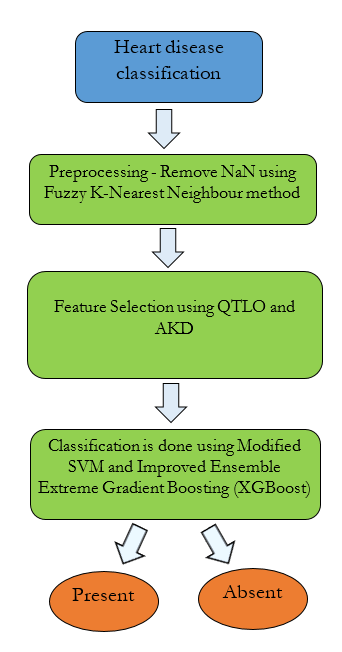
This work’s preprocessing initially removes Nan values using FKNN classifier. FS are based on QTLO and AKD. Heart diseases are classified based on classification methods that use Modified SVM and Improved Ensemble XGBoost. Fig. 1 depicts the architecture of proposed methodology.
3.1 Datasets
The datasets are taken from UCI ML repository. The heart disease dataset has about 76 characteristics, yet the majority of researchers have only used 14 of them in determining whether a patient has cardiac disease or not is the aim of this dataset. It is a number that falls between 0 and 4. Simply trying to distinguish between the existence (values 1, 2, 3, 4) and non-existence (value 0) of cardiac disease has been the main goal of investigations using the Cleveland database.
There are 14 characteristics and 304 instances in the dataset on cardiac disorders, 25 attributes and 400 instances in the dataset on Chronic Kidney Disease(CKD), and 32 attributes and 569 instances in the dataset on breast cancer. Each has a class-based property, such as present and not present. Blood tests and other measurements taken from individuals with or without CKD are included in the CKD dataset. The information was gathered from about 400 patients who were monitored for 60 days. 250 of the 400 individuals had a CKD diagnosis, while 150 did not. The dataset's representation of this variation is called "Class." Age, hypertension, diabetes, blood glucose, blood urea, haemoglobin, and other factors are some of the dataset's key characteristics. One of the common datasets used to diagnose breast cancer is Wisconsin Diagnostic Breast Cancer (WDBC). With 11 characteristics, including a class property, it has over 699 cases, of which 458 are benign and 241 are malignant.
3.2 Preprocessing-Remove Nan Using Fuzzy K-Nearest Neighbour Method
Pre-processing is the process of improving the image data by enhancing certain aspects that are crucial for further processing or suppressing undesired distortions. The preprocessing approach uses a FKNN classifier to remove Nan from the dataset [20]. Using the values from the closest neighbours in the feature space, FKNN fills in the missing pixel values in images for image classification. In order to estimate and replace the missing values, it first finds the K images that are most similar to the one with missing pixels. Then, it uses the pixel values of these images. To guarantee that the model can be trained and assessed efficiently, FKNN preprocesses image data. When FKNN imputation is used to address Nan values in image classification of heart disease, the result is a full and coherent dataset in which estimates from the nearest neighbours are used to replace missing pixel values [21]. By preserving the integrity of the image data, this imputation makes it possible to accurately train and assess classification algorithms. More accurate and trustworthy classification results are produced when the model is tested on extensive and high-quality data. The semi code of FKNN shown in Algorithm.1.
Algorithm 1. Fuzzy K-nearest neighbour.
BEGIN Inputs unknown classifications x.
Let K be 1 ≤ K ≤ n.
Set i = 1.
DO UNTIL (KNNs to x are found) Calculate distances between x and xi.
IF (i ≤ K) THEN sets of K-nearest neighbors xi are included ELSE IF (xi nearer to x than prior nearest neighbour) THEN Eliminate distanced K-nearest neighbors Add xi in K-nearest neighbours set.
END IF END DO UNTIL Initialize i = 1.
DO UNTIL (x assigns memberships to classes) Calculate ui(x) Increase i END DO UNTIL END
3.2.1 Feature selection using quantum teaching learning based optimization and
adaptive kernel density
After the Preprocessing technique is completed, FS is carried out using two algorithms namely, QTLO and AKD. To enhance model performance and lower complexity, both approaches are employed to extract the most pertinent characteristics from a dataset.
3.2.1.1 Quantum teaching learning based optimization
Quantum teaching and learning theories served as the inspiration for the metaheuristic optimization algorithm known as QTLO [22]. It solves optimization issues more effectively by fusing ideas from teaching-learning procedures with quantum computing.
QTLO [23] differs from classical mechanics in that it provides theoretical definitions of particle placements in spaces. The Schrödinger Eq. (1) is solved to determine the particles’ wave functions, Ψ (x, t).
∂Ψ ℏ ∂ Ψ
iℏ = − + VΨ, (1)
∂t 2m ∂ t which represents square roots of -1, V stands for potential energy functions, and ℏ represents Plank’s original constant (h) divided by 2π in Eq. (2).
−34 (2)
ℏ = = 1.054573 × 10 js.
The Schrödinger equation is analogous to Newton's second law, according to Born's statistical interpretation of the wave function. The likelihood of discovering the particle at place x at time t is |Ψ( , )| depicted in Eq. (3).
2 probability of finding the particle
|Ψ(x, t)| dx = { }. (3)
between x and x + dx at time t Schrodinger equations can be solved by separations of variables in Eq. (4).
Ψ(x, t) = ψ(x). φ(t), (4)
where ψ implies functions of x, and φ stands for functions of t and separations are depicted as Eq. (5).
1 dφ ℏ 1 d φ
iℏ = − + V = E. (5)
φ dt 2m φ dx The second part of Eq. (5) is the time-independent Schrodinger equation. The potential function V(x) must be given in order to respond to Eq. (5). One of the most well-known potential functions is the one-dimensional Delta potential function, which uses the Dirac delta function formulation. After solving the time-independent Schrodinger equation, the existence probability of each particle in quantum space may be ascertained. The Dirac delta function, δ(x), is defined by Eq. (6).
0 if x ≠ 0
δ(x) = { } with ∫ δ(x)dx = 1, (6)
∞ if x = 0 δ(x − a) imply spikes of unit areas at points a. When δ(x − a) is multiplied by ordinary functions f(x) are same as multiplying by f(a) in Eq. (7).
f(x)δ(x − a) = f(a)δ(x − a). (7)
Since products are zero except at points a. In particular,
+∞ +∞
∫ f(x) δ(x − a)dx = ∫ f(a) δ(x − a)dx = f(a). (8)
−∞ −∞
Considering potentials of forms in Eq. (8).
V(x) = −αδ(x), (9)
where α stands for constants and on replacing Eq. (5) with Eq. (9), Schrodinger Eq. (10) gets transformed as;
− − αδ(x)ψ = Eψ, (10)
2m dx or
2 (11)
+ k ψ = 0 dx and Eq. (12) is given by;
2 (12)
k=√−2mE/ℏ
These potentials yield bound (E < 0)and scattering (E > 0) states in regions x < 0, V(x) = 0, where E assumes negative values assuming k is +real values. The solution to Eq. (11) is
−kx kx (13)
ψ = Ae + Be ,
Equation’s first terms blow up as x → −∞, hence A = 0 for Eq. (14).
kx (14)
ψ = Be , x < 0.
In regions x > 0, V(x) are again 0 and general solutions assume forms given by Eq. (15).
−kx kx (15)
ψ = Ce + De .
The second term expands as (as x → +∞) transforming Eq. (16) as;
−kx (16)
ψ = Ce , x > 0.
Subsequently these two functions need to be combined with the proper boundary conditions at = 0. / is continuous except at locations where the potential is infinite, and is always continuous. In this instance, the first boundary condition, found in Eq. (17), shows that C = B
kx
Be , x < 0
ψ(x) = { }. (17)
−kx
Be , x > 0 We begin with a one-dimensional particle analysis. The potential energy of the particle in a one-dimensional Delta potential well with point p (local attractor) at the center of the potential well is represented by Eq. (18).
V(x) = −αδ(x − p) = −α δ(y). (18)
Letting x − p = y, with m representing particle’s mass. The base is in integrating Schrodinger equation from −ε to + ε, with limit as ε → 0:
The Eqs. (19-21), derive Schrodinger equation for QTLO used to choose dataset’s relevant features;
+ε 2 2 +ε
ℏ d ψ(y)
∫ (− − αδ(y)ψ(y))dy = ∫ (Eψ(y))dy = 0, (19)
−ε 2m dy −ε
′ − ′ − (20)
ψ (0 ) − ψ (0 ) = −α ψ(0),
−2Bk = −α B. (21)
Thus, the QTLO is implemented using the Eqs. (22) and (23).
αm
k = , (22)
2 2 2
ℏ k a m
E = E = − = . (23)
2m 2ℏ
3.2.2 Adaptive kernel density
AKD in image classifications estimate probable densities of data points in a feature space [24]. This technique helps improve the classification by providing a more accurate representation of the data distribution, especially in cases where the data is not uniformly distributed. Here the AKD is used to select the important features relevant to QTLO. It helps to detect the heart disease more efficiently. As an efficient solution for handling the limitations of Kernel Density, AKD is proposed. The AKD equation is given in Eq. (24);
V(x) = −αδ(x − p) = −α δ(y). (23)
3.2.2 Adaptive kernel density
AKD in image classifications estimate probable densities of data points in a feature space [24]. This technique helps improve the classification by providing a more accurate representation of the data distribution, especially in cases where the data is not uniformly distributed. Here the AKD is used to select the important features relevant to QTLO. It helps to detect the heart disease more efficiently. As an efficient solution for handling the limitations of Kernel Density, AKD is proposed. The AKD equation is given in Eq. (24);
1 1 x − Xi
̃ f(x) = ∑ k ( ), (24)
n d h(X ) h(Xi) i
MSE
̃ 2 8 2 −1 2 (25)
f(x)) ≅ δkh A (x) + (nh) S(k)f (x),
where the Eq. (26) is given by;
d 1 3 1
4 ′ (26)
A(x) = [ ] , δk = ∫ x k(x)dx, S(k) = R(k) + R(xk ), 4 ( ) dx f x 2 4
̂ 1/2 ̂
where h(Xi) must be proportional to (g/f(Xi)) where g is the geometric mean of f(Xi) values. The three-stage algorithm to compute AKD is as follows:
I. Calculate pilot estimations ̂f(X ) by using KDE with fixed bandwidths h for data points.
̂ −α f(Xi)
II. Calculate local bandwidths as λi = { } and α representing sensivity parameters commonly assume value of 0.5.
III. Calculate adaptive bandwidths as h(Xi) = hλi and estimate adaptive kernel densities based on Eq. (27);
1 1 x − Xi 1 1 x − Xi
f (x) = ∑ K ( ) = ∑ K ( ). (27)
n h(Xi) h(Xi) nh λi hλi
i=1 i=1
By using two algorithms such as QTLO and AKD in image classifications, significant enhancements in evaluations of accuracies, precisions, recalls and f-measures. QTLO effectively reduces the feature space and optimizes the dataset, while AKD provides a more accurate estimation of the data distribution, leading to better classification decisions.
3.3 Classification Using Modified Support Vector Machines and Improved Ensemble Extreme Gradient Boosting (Xgboost)
FS is done to select the important features in the dataset. Finally, classification of heart disease detection is carried out using MSVM and Improved Ensemble (XGBoost). To overcome the scalability issues in SVM, the Modified SVM is implemented which is suitable to handle large datasets.
3.3.1 Modified support vector machine
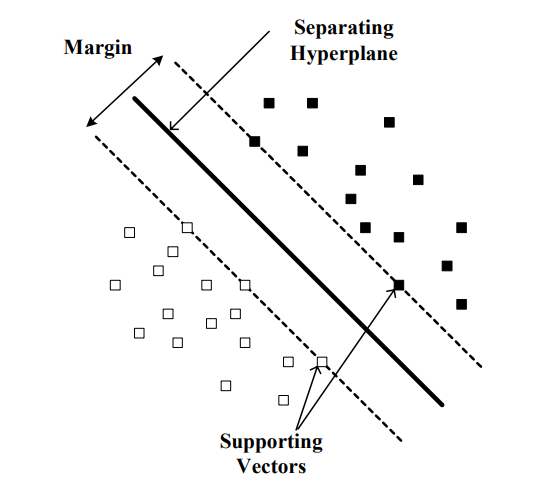
MSVM are often employed in the categorization of cardiac disease because they can efficiently distinguish between various image types using their spectral signatures and handle high-dimensional data. MSVM compromises accuracy for generalization error [25]. and hyperplanes are created. The structure of MSVM shown in Fig. 2.
Considering input data in the form (xi, yi) where vectors xi are in dot product spaces H, and yi are class labels, hyperplanes in H are defined as {x ∈ H|〈w, x〉 + b = 0} w ∈ H, b ∈ R, where w represents vector orthogonal to hyperplanes and 〈w, x〉 imply dot products. Optimal hyperplanes are defined as Eq. (28);
2 (28)
min τ(w) = ∥ w ∥ , w∈H,b∈R 2 subject to yi(〈xi, w〉 + b) ≥ 1, for i = 1,2, … , m where m represents training example counts. The aforesaid issue can be solved by introducing Lagrange multipliers (ai ≥ 0(i = 1, … , m)) and maximizing dual problem in Eq. (29);
max W(α) = ∑ αi − ∑ αiαjyiyj〈xi, xj〉 , (29)
α∈R 2
i=1 i,j=1
subject to αi ≥ 0, i = 1, … . , m, and ∑i=1 αiyi = 0.
Support vectors are the patterns i x that match non-zero Lagrange coefficients. Eq. (30) yields a decision function that looks like this.
y(x) = sgn (∑ αiyi〈xi, x〉 + b), (30)
The optimum margin hyperplane is thus represented by a linear combination of training points. Consequently, the decision function for classifying points in relation to the hyperplane only uses dot products between points. The procedure that finds a separating hyperplane in the feature space can only be expressed in terms of vectors in the input space and dot products in the feature space.
When the samples are not linearly separable, a kernel function is used to translate the data into a higher dimensional space. The kernel function yields the dot product of the two instances without really transforming them into the higher dimensional space. This idea, known as the kernel trick, enables us to carry out the transition to huge dimensional spaces for classification purposes. Eq. (31) consequent decision function in the nonlinear situation takes the following form.
y(x) = sgn (∑ αiyiK〈xi, x〉 + b), (31)
where kernel functions K(xi, x) = 〈φ(xi), φ(x)〉 and φ(x) are nonlinear maps from original spaces to high dimensional spaces where polynomial and Gaussian radial basis functions are very commonly used and given by
′ T ′ k
Polynomial kernel: K(x, x ) = [1 + x X ] k = 2,3
′ 1 ′ 2
Radial basis kernel: K(x, x ) = exp [− ∥ x − x ∥ ] /σ where σ is the spread of the Gaussian function.
MSVM can discover any separating hyperplane for many data sets, and the training data is handled by the kernel function. The SVM may select among a variety of candidate hyperplanes thanks to the maximum margin. Sometimes classes may have the wrong labels. To solve the issue, slack variables ξi and error penalty C are added. Solving the following new quadratic optimization problem in Eq. (32) will yield the best hyperplane.
minimize ∥ w ∥ + C ∑ ξi. (32)
subject to yi(〈xi, w〉 + b) ≥ 1 − ξi.Thus the Modified SVM is implemented for heart disease classification with increased quality of parameters.
3.3.2 Improved ensemble
The other classification method is improved ensemble which is implemented for classifying heart disease detection. A classification system called XGBoost aids in the categorization of heart disease datasets [26]. It is intended for issues where a classifier may be created using a collection of training data. It contributes to a better level of accuracy improvement. A sophisticated version of the enhanced ensemble method, XGBoost is renowned for its effectiveness and performance. By adding a more regularized model formalization to control overfitting, XGBoost enhances the enhanced ensemble approach and becomes a potent algorithm for sophisticated predictive modelling for the prediction of heart disease.
The core idea behind XGBoost is in using residuals to train the model is. With the output of the most recent tree training serving as the input for the subsequent iteration, the error is progressively decreased over a number of dataset iterations [27]. Each weak learner is linearly weighted to generate the ensemble learner. Additionally, during XGBoost tree training, the effective splitting point is chosen using a greedy information-gain based approach. The objective function is best maximized by the quadratic optimal solution, which XGBoost approximates via a second-order Taylor expansion. Additionally, to control the complexity of the spanning tree and reduce the likelihood of overfitting the model, a regular term is introduced. The following is the loss function in Eq. (33);
(t) t−1 1 t−1
n 2 (32)
f = ∑[L(yi, y ̂l ) + ft(xi)) + L ](yi, y ̂l ) + ft (xi) + Ω(ft)).
obj
Ω(ft) = λ ∑ ∥ Wj ∥2 + γT. (33)
In Eq. (34), Wj represents leaf node weights, T represents node counts, and λ and γ are hyperparameters that control node complexities.
In order to reduce the possibility of overfitting the model, the XGBoost approach ensembles weak learners using the shrinkage strategy. This ensemble is represented by Eq. (35), which is seen below.
Fm(X) = Fm−1(X) + ηfm(X), 0 < η < 1, (35)
where fm(X) denotes mth iterations to generate weak learners and Fm(X), denotes mth iterations to generate integrated learners. The model often shows better generalization characteristics when η is less as η has substantial negative correlations with repetitions. The XGBoost technique is used to enhance the model's ability to handle enormous amounts of data and provide better attribute classification results.
4. Results and Discussion
The methods for FS and classification for heart disease detection are implemented. The important features are selected using QTLO and AKD. Finally, heart disease is detected using MSVM and Improved Ensemble (XGBoost). The results can be determined using accuracy, precision, recall and f-measure. The performance of the model is calculated by time period and error rate. These models are compared with existing models and provides a better result.
Fig. 3 shows the accuracy, precision, recall, f-measure for the heart disease dataset. In comparison to Modified Teaching Learning Optimization (DMTLO_SVM), DMTLO_Adaboosting, AKD_MSVM, AKD_XGBoost, and QTLO_MSVM, it is found that the suggested QLTO_XGBoost provides greater accuracy, respectively.
Fig. 4 shows time periods and error rates for the heart disease dataset. In comparison to DMTLO_SVM, DMTLO_Adaboosting, AKD_MSVM, AKD_XGBoost, and QTLO_MSVM, QTLO_XGBoost, and 0.29 times lower than DMTLO_SVM, DMTLO_Adaboosting, AKD_MSVM, AKD_XGBoost, and QTLO_MSVM.
Fig. 5 displays accuracies, Precisions, Recalls, F-measures for the CKD Dataset. In comparison to DMTLO_SVM, DMTLO_Adaboosting, AKD_MSVM, AKD_XGBoost, and QTLO_MSVM, the suggested QTLO_XGBoost provides an accuracy improved respectively.
Fig. 6 Displays time periods and error rates for CKD dataset. In comparison to DMTLO_SVM, DMTLO_Adaboosting, AKD_MSVM, AKD_XGBoost, and QTLO_MSVM, QTLO_XGBoost provides0.33 times lower than DMTLO_SVM, DMTLO_Adaboosting, AKD_MSVM, AKD_XGBoost, and QTLO_MSVM.
Fig. 7 shows comparative values of accuracy, precision, recall, F-Measure for the Breast Cancer Dataset. Compared to DMTLO_SVM, DMTLO_Adaboosting, AKD_MSVM, AKD_XGBoost, and QTLO_MSVM, the suggested respectively. Comparing DMTLO_SVM, DMTLO_Adaboosting, AKD_MSVM, AKD_XGBoost, and QTLO_MSVM, the corresponding F-Measure improved.
Fig. 8 shows time periods and error rates for the breast cancer dataset. Compared to DMTLO_SVM, DMTLO_Adaboosting, AKD_MSVM, AKD_XGBoost, and QTLO_MSVM, QTLO_XGBoost provides a superior time period by 64.1%, 38.47%, 23.1%, 12.82%, and 1.53%, respectively. Similar to DMTLO_SVM, DMTLO_Adaboosting, AKD_MSVM, AKD_XGBoost, and QTLO_MSVM, it has an error rate that is 2.2, 1.4, 1.2, 1, and 0.6 times lower.
5. Conclusion
In this paper, the critical issue of heart disease is addressed which has become a leading cause of mortality and reduced quality of life globally. These algorithms are compared with the existing method Density based DMTLO_SVM and DMTLO_Adaboosting in terms of accuracy, precision, recall, f-measure, time period and error rate. The proposed method of image classification is QTLO_XGBoost which yields a better output when compared with the existing methods. These techniques identify the presence of heart disease that optimizes the model's performance. By proposing a novel methodology that influence ML techniques, this paper achieves 99% accuracy, 98% precision, 97% recall, 98% F-measure, 1.93ms improved time period and 0.07ms lesser error rate for the heart disease prediction through image classification. The results of the proposed methodology are also evaluated for various datasets which includes CKD and breast cancer.
Authors' Contributions
S. M.: Research Design, Data Curation, Software, Investigation, Writing-Original Draft, Methodology, Conceptualization, and Visualization. A. A. N.: Validation, Formal Analysis, Writing-Review & Editing, and Validation. The authors have read and agreed to the published version of the manuscript.
Data Availability
All data supporting the reported findings in this research paper are provided within the manuscript.
Funding
No funding was received to conduct this study.
Conflict of Interest
The authors declare that in this paper, there is no conflict of interests.
Consent for Publication
All authors have provided their consent for the publication of this manuscript.
Ethics Approval and Consent to Participate
No studies involving human participants or animals were performed in this research.
References
- [1] Radhika, R., & George, S. T. (2021, June). Heart disease classification using machine learning techniques. Journal of Physics: Conference Series (Vol. 1937, No. 1, p. 012047). IOP Publishing. https://doi.org/10.1088/1742-6596/1937/1/012047
- [2] Reddy, G. T., & Khare, N. (2018). Heart disease classification system using optimised fuzzy rule based algorithm. International Journal of Biomedical Engineering and Technology, 27(3), 183–202. https://doi.org/10.1504/IJBET.2018.094122
- [3] Tougui, I., Jilbab, A., & El Mhamdi, J. (2020). Heart disease classification using data mining tools and machine learning techniques. Health and Technology, 10(5), 1137–1144. https://doi.org/10.1007/s12553-020-00438-1%0A%0A
- [4] Yadav, S. S., & Jadhav, S. M. (2019). Deep convolutional neural network based medical image classification for disease diagnosis. Journal of Big Data, 6(1), 1–18. https://doi.org/10.1186/s40537-019-0276-2%0A%0A
- [5] Arunkumar, R., & Balakrishnan, N. (2018). Medical image classification for disease diagnosis by DBN methods. Pakistan Journal of Biotechnology, 15(1), 107–110. https://nja.pastic.gov.pk/journals/index.php/PJBT/article/view/6782/6647
- [6] Baccouche, A., Garcia-Zapirain, B., Castillo Olea, C., & Elmaghraby, A. (2020). Ensemble deep learning models for heart disease classification: A case study from Mexico. Information, 11(4), 207. https://doi.org/10.3390/info11040207
- [7] Jabbar, M. A., Deekshatulu, B. L., & Chandra, P. (2013). Classification of heart disease using artificial neural network and feature subset selection. Global journal of Computer Science And Technology Neural & Artificial Intelligence, 13(3), 5–14. https://www.computerresearch.org/index.php/computer/article/view/367
- [8] Huo, B., & Yin, F. (2015). Research on novel image classification algorithm based on multi-feature extraction and modified SVM classifier. International Journal of Smart Home, 9(9), 103–112. http://dx.doi.org/10.14257/ijsh.2015.9.9.11
- [9] Ramraj, S., Uzir, N., Sunil, R., & Banerjee, S. (2016). Experimenting XGBoost algorithm for prediction and classification of different datasets. International Journal of Control Theory and Applications, 9(40), 651–662. https://www.researchgate.net/publication/318132203
- [10] Ganie, S. M., Pramanik, P. K. D., Malik, M. B., Nayyar, A., & Kwak, K. S. (2023). An improved ensemble learning approach for heart disease prediction using boosting algorithms. Computer Systems Science and Engineering, 46(3), 3993–4006. https://doi.org/10.32604/csse.2023.035244
- [11] Bian, Z., Vong, C. M., Wong, P. K., & Wang, S. (2020). Fuzzy KNN method with adaptive nearest neighbors. IEEE Transactions On Cybernetics, 52(6), 5380–5393. https://doi.org/10.1109/TCYB.2020.3031610
- [12] Wang, H., Xu, P., & Zhao, J. (2021). Improved KNN algorithm based on preprocessing of center in smart cities. Complexity, 2021(1), 5524388. https://doi.org/10.1155/2021/5524388
- [13] Kaveh, A., Kamalinejad, M., Hamedani, K. B., & Arzani, H. (2021). Quantum teaching-learning-based optimization algorithm for sizing optimization of skeletal structures with discrete variables. In Structures (Vol. 32, pp. 1798-1819). Elsevier. https://doi.org/10.1016/j.istruc.2021.03.046
- [14] Singh, S., Pandian, M. T., Aggarwal, A. K., Awasthi, S. P., Bhardwaj, H., & Pruthi, J. (2023). Quantum learning theory: A classical perspective for quantum image. Materials Today: Proceedings, 80, 2786–2793. https://doi.org/10.1016/j.matpr.2021.07.039
- [15] Van Kerm, P. (2003). Adaptive kernel density estimation. The Stata Journal, 3(2), 148–156. https://doi.org/10.1177/1536867X0300300204
- [16] Nedelea, L., Neag, M., Topa, M., & Festila, L. (2006). A new CCII-based universal biquad. In 2006 IEEE International Conference on Automation, Quality and Testing, Robotics (Vol. 1, pp. 195–198). IEEE. https://doi.org/10.1109/AQTR.2006.254524
- [17] Ogunleye, A., & Wang, Q. G. (2020). XGBoost model for chronic kidney disease diagnosis. IEEE/ACM Transactions on Computational Biology and Bioinformatics, 17(6), 2131–2140. https://doi.org/10.1109/TCBB.2019.2911071
- [18] Henry, T., Carré, A., Lerousseau, M., Estienne, T., Robert, C., Paragios, N., & Deutsch, E. (2020, October). Brain tumor segmentation with self-ensembled, deeply-supervised 3D U-net neural networks: A BraTS 2020 challenge solution. International MICCAI Brainlesion Workshop (pp. 327-339). Cham: springer international publishing. https://doi.org/10.1007/978-3-030-72084-1_30%0A%0A
- [19] Naseer, A., Yasir, T., Azhar, A., Shakeel, T., & Zafar, K. (2021). Computer-aided brain tumor diagnosis: performance evaluation of deep learner CNN using augmented brain MRI. International Journal of Biomedical Imaging, 2021(1), 5513500. https://doi.org/10.1155/2021/5513500
- [20] Kumar, A. (2023). Study and analysis of different segmentation methods for brain tumor MRI application. Multimedia Tools and Applications, 82(5), 7117–7139. https://doi.org/10.1007/s11042-022-13636-y%0A%0A
- [21] Srinivas, C., KS, N. P., Zakariah, M., Alothaibi, Y. A., Shaukat, K., Partibane, B., & Awal, H. (2022). Deep transfer learning approaches in performance analysis of brain tumor classification using MRI images. Journal of Healthcare Engineering, 2022(1), 3264367. https://doi.org/10.1155/2022/3264367
- [22] Agrawal, R., Sharma, M., & Singh, B. K. (2019). Segmentation of brain tumour based on clustering technique: Performance analysis. Journal of Intelligent Systems, 28(2), 291–306. https://doi.org/10.1515/jisys-2017-0027
- [23] Biratu, E. S., Schwenker, F., Ayano, Y. M., & Debelee, T. G. (2021). A survey of brain tumor segmentation and classification algorithms. Journal of Imaging, 7(9), 179. https://doi.org/10.3390/jimaging7090179
- [24] Awad, M., & Fraihat, S. (2023). Recursive feature elimination with cross-validation with decision tree: Feature selection method for machine learning-based intrusion detection systems. Journal of Sensor And Actuator Networks, 12(5), 67. https://doi.org/10.3390/jsan12050067
- [25] Kołodziejczyk, J., & Tarasenko, Y. (2021). Particle swarm optimization and L´ evy flight integration. Procedia Computer Science, 192, 4658-4671. https://doi.org/10.1016/j.procs.2021.09.244
- [26] Solanki, S., Singh, U. P., Chouhan, S. S., & Jain, S. (2023). Brain tumor detection and classification using intelligence techniques: An overview. IEEE Access, 11, 12870–12886. https://doi.org/10.1109/ACCESS.2023.3242666
- [27] Khairandish, M. O., Sharma, M., & Kusrini, K. (2020). The performance of brain tumor diagnosis based on machine learning techniques evaluation-a systematic review. In 2020 3rd International Conference on Information And Communications Technology (ICOIACT) (pp. 115-119). IEEE. https://doi.org/10.1109/ICOIACT50329.2020.9332131