
Early Detection of Retinopathy of Prematurity Using Machine Learning (Convolutional Neural Network)
Abstract
This paper describes a method for using an Machine Learning (ML) model to detect Retinopathy of Prematurity (RoP) disease in newborn infants. To diagnose the disease, a suitable ML algorithm should be used. The Convolutional Neural Network (CNN) method is used in this situation because it can effectively extract the smallest information from images. 16000 images are used in this collection. The anatomy and presence of a demarcation line in the retina can be used to distinguish between early ROP stages. To accomplish this, our proposed technique first trains an object segmentation model to recognize the demarcation line at the pixel level, and then adds the resulting mask as an additional "color" channel in the original image. The method then trains a CNN classifier on the changed images using data from both the original image and the mask, helping to focus the model's attention on the demarcation line. An accuracy of 85% has been observed in this model.
Keywords:RetinopathyConvolutional neural networkKaggleMachine learning
1. Introduction
Premature babies are more likely to get the severe eye condition Retinopathy of Prematurity (ROP), which can afflict them, if they are delivered too early or have birth weights under 1,250 grammes. If untreated, ROP can result in vision loss or even blindness since it is brought on by irregular blood vessel formation in the retina. To avoid severe vision loss, ROP includes five stages, each of which needs to be identified and treated. ROP can be difficult to diagnose with the traditional procedures, which rely on the expert judgement of ophthalmologists. According to the characteristics of the blood vessels in the posterior pole, ROP can also be classified as normal, plus, pre-plus, or Aggressive Posterior Retinopathy of Prematurity (AP-ROP). Between normal and plus ROP is pre-plus ROP, plus ROP is distinguished by increasing venous dilatation and arteriolar tortuosity of the arteries, and AP-ROP is a plus ROP variant that manifests quickly. The strategy has greatly automated label diagnosis through the use of deep learning techniques.
The use of Machine Learning (ML) techniques to aid in ROP diagnosis has showed potential [1]. In order to find patterns and make predictions about the diagnosis and course of diseases, ML systems may analyze enormous databases of patient information, including medical histories and retinal scans. These algorithms might be able to spot cases of ROP and help create individualized treatment regimens for affected newborns. In this study, the Convolutional Neural Network (CNN) approach was employed to identify ROP illness. For the processing of visual input, such as images and videos, a deep learning model known as a CNN was developed. It is extensively used in computer vision applications like object recognition, picture classification, and image segmentation. The design of a CNN is based on how the visual cortex of the human brain is laid out.
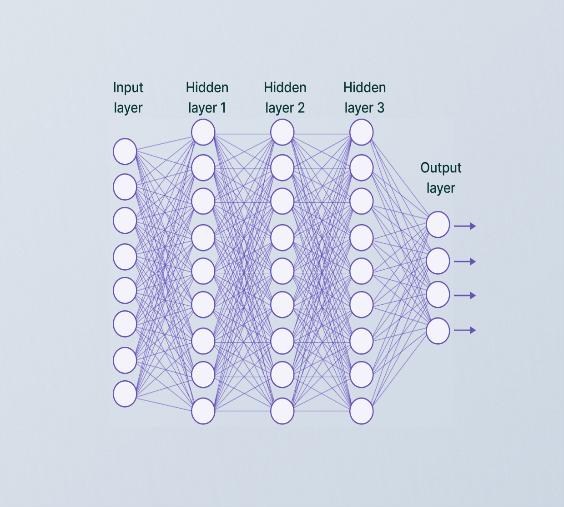
Each of the layers that make up a CNN contributes differently to the feature extraction and classification process.
2. Literature Survey
Conv2D makes use of the "relu" function. Next, research on batch ROP has advanced significantly during the past few decades. We discovered the causes and a methodical examination of ROP through the survey we did. Describe instances of diseased and non-diseased ROP in images of infants and discover ROP cases that were missed by conventional screening by using the CNN model [1]. Risk factors, remedies, and ROP disease prevention based on deep learning [2]. Common and different stages Networks utilizing pre-trained weights and newly-trained networks are compared [3]. To visualize the input images in the test dataset for the diagnosis of ROP, guided algorithms and deep neural networks are used [4]. Utilizing ML, ROP feature extraction and disease staging [5].
3. Proposed Work
3.1 Data Collection
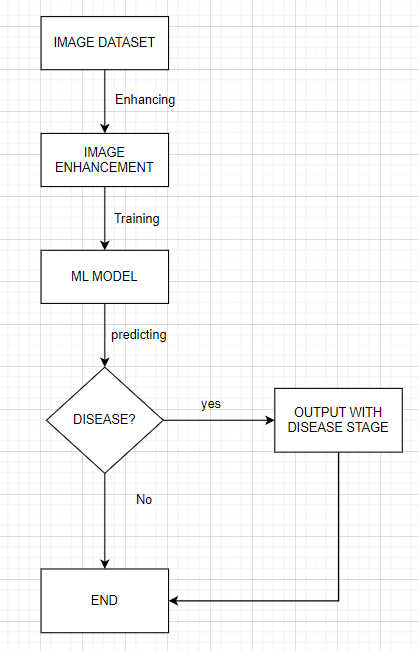
Step 1. Data from the Kaggle and Google datasets are being acquired in order to train the model and use Data Augmentation on it.
3.2 Data Augmentation
It is a ML method that artificially boosts the variety and amount of a training dataset by making a variety of adjustments or changes to the existing data samples. To improve the performance and generalization of ML models, data augmentation involves creating new, accurate representations of the original data.
3.3 Image Enhancement
Step 2. The photos have been enhanced for clarity to assist straightforward disease detection.
The brightness, contrast, and general quality of the images are enhanced using various image enhancement techniques by applying filters to the photographs and resizing them.
The quality or appearance of a picture can be improved using a variety of image enhancement techniques in ML. Here are some commonly used techniques:
I. Gaussian smoothing: the method of "gaussian smoothing," also known as "gaussian blur," lowers noise and enhances visual details by convolving the image with a Gaussian kernel. The overall quality of the image might be improved while high-frequency noise could be decreased.
II. Sharpening filters: the edges and features of an image are improved with sharpening filters like the Laplacian or unsharp masking ones. They emphasize high-frequency components to provide the impression of a cleaner, more focused image.
III. Super-resolution: super-resolution techniques are employed to transform one or more low-resolution images into a higher-resolution image. With the use of ML models like CNNs, these algorithms learn the mapping between low-resolution and high-resolution image patches.
IV. Image deblurring: the purpose of image deblurring techniques is to make a fuzzy image sharp again. In order to restore the image to its initial state, some methods employ algorithms like blind deconvolution or make advantage of the blur kernel's prior knowledge.
V. Style transfer: techniques for style transfer make it possible to keep the content of an image while transferring its style to another. Using deep learning models like neural networks, these techniques separate and combine the content and stylistic components of two pictures to produce an aesthetically acceptable fusion.
VI. Colorization: using colorization techniques, grayscale or partially coloured photographs can be made colourful. By employing ML models to discover the correlation between grayscale values and complementary hues, these techniques turn the image into a coloured version.
VII. Contrast enhancement: the contrast of the image is altered via contrast enhancement techniques to make it simpler to discern between different objects or regions. Histogram equalization, Adaptive Histogram Equalization (AHE), and contrast stretching are common methods for improving contrast.
3.4 Training ML model
Step 3. To identify the disease, ML model is trained using the image dataset. The model contains four Conv2D layers.
Conv2D
A CONV2D layer performs convolutional operations on the input data, which is usually an image or a feature map. The CONV2D layer aims to extract significant features from the input data using a variety of trainable filters or kernels. Many CONV2D layers are frequently layered together in a CNN model, and each layer learns various attributes at various levels of abstraction. The model can learn more complicated features as the data moves through the network because the output of one CONV2D layer serves as the input for the following layer.
This scenario uses a 2x2 kernel for maxpooling and activation normalization. In order to reduce the spatial dimensions of the feature maps while retaining the most important data, maxpooling is a down sampling approach that is often employed in CNNs. Typically, a convolutional layer is placed in front of it. Max pooling is used to extract the standout features from a certain region of the input feature map. It separates the input feature map into rectangular, non-overlapping "pooling regions" or "pooling windows" and outputs the highest value located within each region.
Here's how max pooling works:
I. Pooling window: a stride value plus a fixed size (such 2x2 or 3x3) together define a pooling window. In order to avoid overlap, the pooling window moves over the input feature map with a preset stride, often equal to its size.
II. Maximum value extraction: for each pooling window, the maximum value is selected. This value represents the most prominent feature or activation in that region.
III. Output feature map: the highest value from each pooling window is then used to create a down sampled feature map. The spatial dimensions of the output feature map are less than those of the input feature map since the pooling procedure down sampled the data.
In this instance, we made use of the reLU activation function. This function is often used in neural networks, such as CNNs. It gives the network nonlinearity by immediately creating the input if it is positive and zero otherwise.
This is how it is explained.
ReLU(x) = max (0, x) with a 0.25 dropout. The dropout rate for this model is minimal—between 0.1 and 0.3. Lower dropout values give less regularization, allowing the network to extract more information from the data. This may be a good place to start if the model is not prone to overfitting. The whole model employs a 5-node output layer and 512 total neurons.
3.5 Generation of Output
Step 4. The output of a CNN model for image classification tasks is frequently a probability distribution over a set of predetermined classes [6]. The Predefined classes include both images with and without ROP. Each class has a unique name or category that it falls under. The probability value assigned to each class by the model indicates how probable it is that the input image belongs to that class. The anticipated class is often the one with the highest likelihood. The CNN model has been trained to spot trends and traits in retinal images that indicate ROP. After training, a trained CNN model outputs a predicted probability or class label for the presence or absence of ROP in the input image when a new retinal picture is passed through the model.
I. Probability output: a probability score generated by the CNN model can hint at the likelihood that ROP is present in the retinal image. This probability score typically runs from 0 to 1, with a number nearer 1 indicating a higher possibility of ROP and a value nearer 0 indicating a decreased likelihood of ROP. For instance, a score of 0.8 means that there is an 80% possibility that ROP is present in the image.
II. Class label output: the CNN model may produce a class label that expresses whether ROP is present or absent. A binary classification commonly identifies the input image as "ROP" or "Non-ROP" after it is received. The model's decision boundary in this case is determined by a threshold probability, and the result is a categorical prediction. For example, if the threshold is set at 0.5, any probability above that level may be marked as ROP, while any likelihood below it could be labelled as non-ROP.
4. Experimental Results
CNNs have demonstrated good outcomes in the identification of ROP, and it is encouraging that they may enhance the precision, reproducibility, and effectiveness of ROP screening and diagnosis. The total performance of our system is displayed in the confusion matrix below [7].
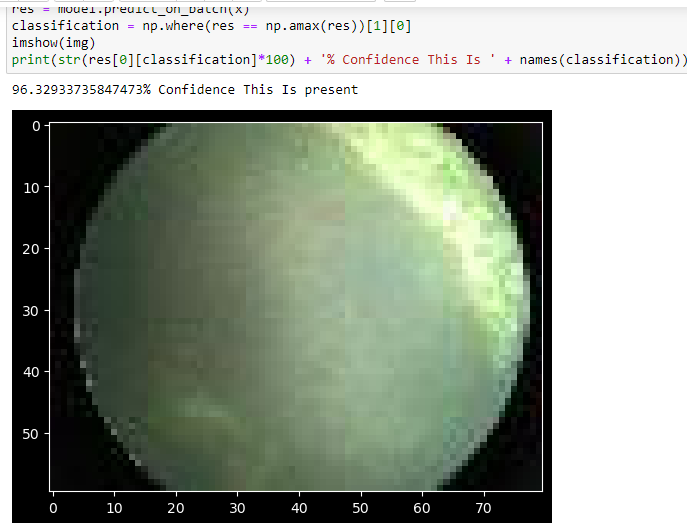
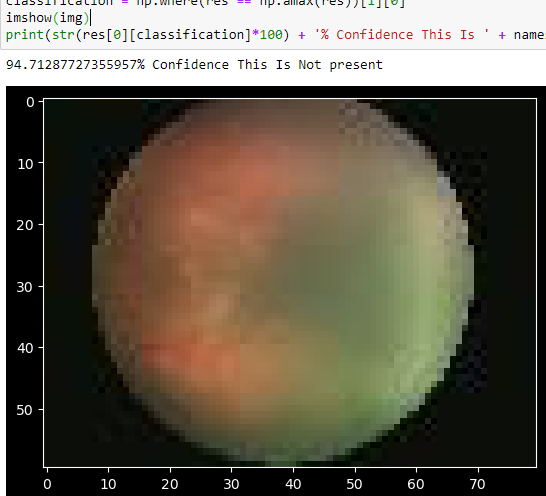
The figure above demonstrates the existence of ROP illness. It demonstrates abnormal retinal growth and vascularization, typically brought on by an infant's early delivery. ROP can range in severity from mild to severe.
An eye that is healthy is shown in the figure above, where the retinal blood vessels are growing normally and extending from the optic nerve. The arteries that go all the way to the edge of the retina supply the retina with the necessary blood flow.
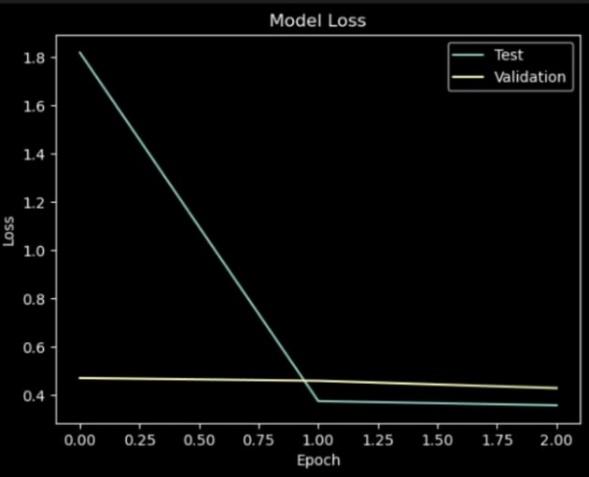
In the context of ROP sickness detection using CNN, a model vs. epoch graph shows how the performance of the CNN model evolves during training epochs. It helps in understanding training progress and the model's convergence over time.
The model vs epoch graph in the identification of ROP disease is described as follows:
4.1 Model
explains the CNN model architecture that is being trained to recognize ROP. It covers the layers, properties, and connections of the network.
4.2 Epoch
A complete training dataset iteration is referred to as an epoch. At the start of each epoch, the CNN model is trained on sets of images, and as computed gradients are applied, its weights are adjusted.
4.3 Performance Metric
The graph's y-axis displays an assessment metric for the model's performance. This parameter can represent accuracy, loss, precision, recall, or any other metric to indicate how well the model can identify ROPs. The precise statistic to be used is frequently decided by the challenge's requirements and evaluation criteria.
4.4 Training Set Performance
The training set performance of the CNN model on the training set at each epoch is referred to as. The degree to which the model matches the training data is revealed as training progresses. To calculate the performance metric, the projected outputs of the model are contrasted with the training set's ground truth labels.
4.5 Validation Set Performance
The validation set performance is the performance of the CNN model over each epoch on a distinct validation set. The validation set is a subset of the data that is not used for training but is rather examined to determine whether the model is generalizable. It helps to assess how well the model fits the data—whether it does so well or poorly. The performance metric for the validation set is derived from the training set's performance metric.
4.6 Convergence
The behaviour of the performance metric across epochs can be used to determine if the model has converged. As the model becomes more adept at spotting patterns in the data, the performance may initially be inconsistent before improving. The performance improvement could, however, eventually start to level off or show decreasing results. This implies that the model is convergent and that additional training could not significantly affect performance.
4.7 Overfitting or Underfitting
Examining the model vs. epoch graph makes it possible to identify over- or underfitting. When a model performs well on a training set while failing miserably on a validation set, this is referred to as overfitting and indicates that the model is memorizing the training data rather than generalizing. It is obvious that underfitting has occurred when the model performs badly on both the training and validation sets. This means that the model is not correctly capturing the patterns in the data.
The model vs. epoch graph provides detailed insight into the training process, helpful in assessing the model's convergence, performance, and any potential issues like overfitting or underfitting. Making judgements about additional changes to the CNN architecture or training process, as well as the ideal number of epochs to use when training the model, are made easier with its assistance.
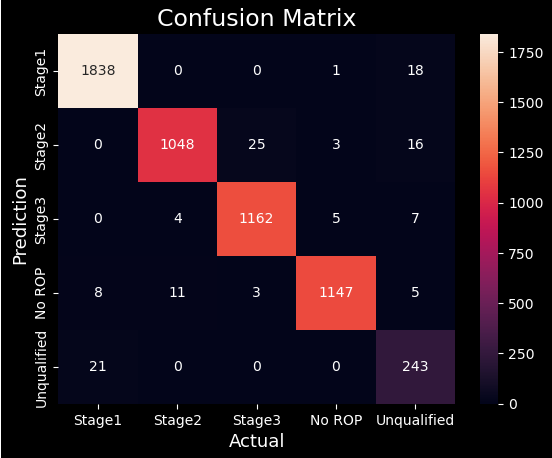
From above confusion matrix, accuracy of our system is calculated by:
5. Accuracy
= (TP + TN)/(TP + TN + FP + FN), = ((1838 + 1048 + 1162 + 1147 + 243)/(5565)), = 97.71%.
Here, TP: True Positive.
TN: True Negative.
FP: False Positive.
FN: False Negative.
6. Conclusion
In conclusion, CNNs have been effectively used to identify ROP. CNN models are trained using enormous datasets of retinal images, including both ROP-positive and ROP-negative examples [9].
CNNs are trained to extract relevant properties from retinal pictures using convolutional layers, pooling layers, and non-linear activation functions like ReLU. Dropout regularization typically prevents overfitting. The trained CNN model can then be applied for ROP detection by giving it retinal pictures. The model performs forward propagation by extracting features and offering predictions based on observed patterns. The outcome may be a probability score or a class designation indicating the presence or absence of ROP. The accuracy of ROP detection using CNNs is influenced by the architecture, hyperparameters, training process, and training data quality of the CNN model [10]. Measures including accuracy, loss, precision, and recall can be used to assess the model's performance.
The performance of the model over training epochs can be monitored using a graph of the model versus epoch. This graph serves in determining the appropriate number of training epochs and provides information on the model's convergence, overfitting, and underfitting issues.
Overall, CNNs have demonstrated their value in ROP detection by making advantage of their ability to learn complex patterns and features from retinal pictures. The continual advancements in CNN architectures and training techniques are increasing the precision and dependability of ROP detection systems.
The future scope of this work includes enlarging the dataset to comprise photos from various populations and clinical situations, gauging the ML model's performance on a bigger scale, and supplementing the dataset with extra clinical information to boost accuracy. The proposed study might be broadened to look at the application of ML to forecast ROP patients' long-term effects and treatment outcomes. and treatment.
Author Contributions
Rita de Fatima Muniz was the main contributor to the conceptual framework, methodology development, and writing of the manuscript. Sheila Maria Muniz played a key role in gathering data, reviewing relevant literature, and editing the manuscript. Lu Fan provided assistance with model creation, training, and evaluating performance. Muhammet Karabulut handled data preprocessing methods, created visualizations, and revised the final manuscript. All authors have reviewed and approved the article's final version.
Funding
This investigation did not obtain any particular funding from public, commercial, or non-profit organizations. All research efforts were carried out using institutional resources and through voluntary academic collaboration among the authors.
Conflicts of Interest
The authors state that there are no conflicts of interest concerning the study's content, methodology, or results. The research was conducted independently, free from any influence by commercial or financial entities.
References
- [1] Ataer-Cansizoglu, E., Bolon-Canedo, V., Campbell, J. P., Bozkurt, A., Erdogmus, D., Kalpathy-Cramer, J. (2015). Computer-based image analysis for plus disease diagnosis in retinopathy of prematurity: performance of the “i-ROP” system and image features associated with expert diagnosis. Translational vision science & technology, 4(6), 5. https://doi.org/10.1167/tvst.4.6.5
- [2] Książek, W., Abdar, M., Acharya, U. R., & Pławiak, P. (2019). A novel machine learning approach for early detection of hepatocellular carcinoma patients. Cognitive systems research, 54, 116–127. https://doi.org/10.1016/j.cogsys.2018.12.001
- [3] Wang, J., Ju, R., Chen, Y., Zhang, L., Hu, J., Wu, Y., … Yi, Z. (2018). Automated retinopathy of prematurity screening using deep neural networks. EBioMedicine, 35, 361–368. https://doi.org/10.1016/j.ebiom.2018.08.033
- [4] Zhang, Y., Wang, L., Wu, Z., Zeng, J., Chen, Y., Tian, R., Zhang, G. (2018). Development of an automated screening system for retinopathy of prematurity using a deep neural network for wide-angle retinal images. IEEE access, 7, 10232–10241. https://doi.org/10.1109/ACCESS.2018.2881042%0D
- [5] Luo, Z., Ding, X., Hou, N., & Wan, J. (2022). A deep-learning-based collaborative edge-cloud telemedicine system for retinopathy of prematurity. Sensors, 23(1), 276. https://doi.org/10.3390/s23010276
- [6] Ding, A., Chen, Q., Cao, Y., & Liu, B. (2020). Retinopathy of prematurity stage diagnosis using object segmentation and convolutional neural networks IEEE. 2020 international joint conference on neural networks (IJCNN) (pp. 1–6). https://doi.org/10.1109/IJCNN48605.2020.9207288
- [7] Zhong, B., Xing, X., Love, P., Wang, X., & Luo, H. (2019). Convolutional neural network: deep learning-based classification of building quality problems. Advanced engineering informatics, 40, 46–57. https://doi.org/10.1016/j.aei.2019.02.009
- [8] Mulay, S., Ram, K., Sivaprakasam, M., & Vinekar, A. (2019). Early detection of retinopathy of prematurity stage using deep learning approach IEEE. Medical imaging 2019: computer-aided diagnosis (pp. 758–764). https://doi.org/10.1117/12.2512719
- [9] Wang, G., Kikuchi, Y., Yi, J., Zou, Q., Zhou, R., & Guo, X. (2022). Transfer learning for retinal vascular disease detection: a pilot study with diabetic retinopathy and retinopathy of prematurity. ArXiv preprint arxiv:2201.01250. https://doi.org/10.48550/arXiv.2201.01250
- [10] Brown, J. M., Campbell, J. P., Beers, A., Chang, K., Ostmo, S., Chan, R. V. P. (2018). Automated diagnosis of plus disease in retinopathy of prematurity using deep convolutional neural networks. JAMA ophthalmology, 136(7), 803–810. https://doi.org/10.1001/jamaophthalmol.2018.1934